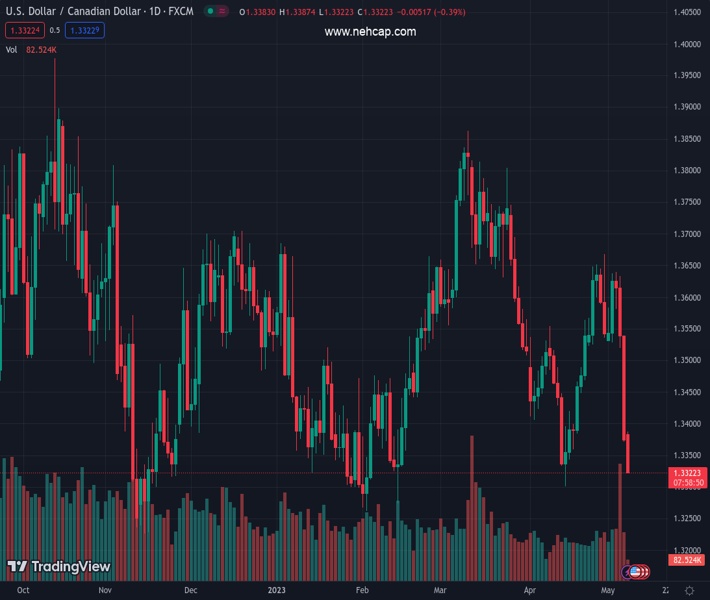
#USDCAD @ 1.33253 remains under heavy selling pressure for the fourth successive day on Monday. (Pivot Orderbook analysis)
…
This is a premium post.
[s2If !current_user_can(access_s2member_level4)]Please register for FREE REGISTER to read full post below containing analysis. In case of any error or you think you are not able to read the full post below, please email us at support#nehcap.com [lwa][/s2If] [s2If current_user_can(access_s2member_level1)]
- USD/CAD remains under heavy selling pressure for the fourth successive day on Monday.
- A further recovery in Oil prices underpins the Loonie and drags the pair to a multi-week low.
- A weaker USD contributes to the fall amid some technical selling below the 200-day SMA.
The pair currently trades last at 1.33253.
The previous day high was 1.3542 while the previous day low was 1.3371. The daily 38.2% Fib levels comes at 1.3436, expected to provide resistance. Similarly, the daily 61.8% fib level is at 1.3476, expected to provide resistance.
The USD/CAD pair prolongs its bearish trajectory for the fourth successive day on Monday and dives to over a three-week low, around the 1.3325-1.3320 region heading into the North American session.
Crude Oil prices build on last week’s solid rebound from a 17-month low and gain strong follow-through traction for the third straight day amid the optimism over a fuel demand recovery in the wake of easing concerns about an imminent recession. This, along with Friday’s upbeat Canadian monthly employment details, underpins the commodity-linked Loonie. Apart from this, a modest US Dollar (USD) weakness contributes to the heavily offered tone surrounding the USD/CAD pair.
In fact, the USD Index (DXY), which tracks the Greenback against a basket of currencies, languishes near the monthly low set last week amid growing acceptance for an imminent pause in the Federal Reserve’s (Fed) over a year-long rate-hiking cycle. The Fed Fund futures point to a 90% probability that the US central bank will hold interest rates steady in June. Moreover, the markets have also started pricing in the possibility that the Fed beginning cutting rates in the second half of this year.
This, along with worries about a full-blown banking crisis and the US debt ceiling, keeps the USD bulls on the defensive amid a positive risk tone and exerts additional downward pressure on the USD/CAD pair. That said, a goodish intraday pickup in the US Treasury bond yields helps limit deeper losses for the Greenback as traders now look to the latest US consumer inflation figures for a fresh impetus. This, in turn, could lend some support to the major and warrants some caution for bearish traders.
From a technical perspective, Friday’s decisive break and close below the very important 200-day Simple Moving Average (SMA) marked a fresh breakdown. This, in turn, supports prospects for a further near-term depreciating move. Hence, any attempted recovery runs the risk of fizzling out rather quickly and is more likely to remain capped, at least for the time being, in the absence of any relevant market-moving economic releases, either from the US or Canada.
Technical Levels: Supports and Resistances
USDCAD currently trading at 1.3331 at the time of writing. Pair opened at 1.3374 and is trading with a change of -0.32 % .
| Overview | Overview.1 | |
|---|---|---|
| 0 | Today last price | 1.3331 |
| 1 | Today Daily Change | -0.0043 |
| 2 | Today Daily Change % | -0.3200 |
| 3 | Today daily open | 1.3374 |
The pair remains strongly bearish on the daily time frame. It trades below the 20 SMA @ 1.3502, 50 SMA 1.3585, 100 SMA @ 1.3524 and 200 SMA @ 1.3446.
| Trends | Trends.1 | |
|---|---|---|
| 0 | Daily SMA20 | 1.3502 |
| 1 | Daily SMA50 | 1.3585 |
| 2 | Daily SMA100 | 1.3524 |
| 3 | Daily SMA200 | 1.3446 |
The previous day high was 1.3542 while the previous day low was 1.3371. The daily 38.2% Fib levels comes at 1.3436, expected to provide resistance. Similarly, the daily 61.8% fib level is at 1.3476, expected to provide resistance.
Note the levels of interest below:
- Pivot support is noted at 1.3317, 1.3259, 1.3146
- Pivot resistance is noted at 1.3487, 1.3599, 1.3657
| Levels | Levels.1 |
|---|---|
| Previous Daily High | 1.3542 |
| Previous Daily Low | 1.3371 |
| Previous Weekly High | 1.3639 |
| Previous Weekly Low | 1.3371 |
| Previous Monthly High | 1.3668 |
| Previous Monthly Low | 1.3301 |
| Daily Fibonacci 38.2% | 1.3436 |
| Daily Fibonacci 61.8% | 1.3476 |
| Daily Pivot Point S1 | 1.3317 |
| Daily Pivot Point S2 | 1.3259 |
| Daily Pivot Point S3 | 1.3146 |
| Daily Pivot Point R1 | 1.3487 |
| Daily Pivot Point R2 | 1.3599 |
| Daily Pivot Point R3 | 1.3657 |
[/s2If]
Nehcap Expert Advisor
The NEHCAP MT4 EA is high quality professional trading system geared to generate returns without using GRID or martingales. Each trade has strict risk per trade parameter. The pairs under management include EURUSD, GBPUSD, AUDCAD, AUDNZD,GBPAUD, EURAUD, EURCAD, CHFJPY and many more.
The system is trading live: LIVE ACCOUNT TRACKING
You can run it free. Apply for a free trial and track our account. Buy the system or use profit share mechanism to generate returns on your MT4.
Join Our Telegram Group
")


