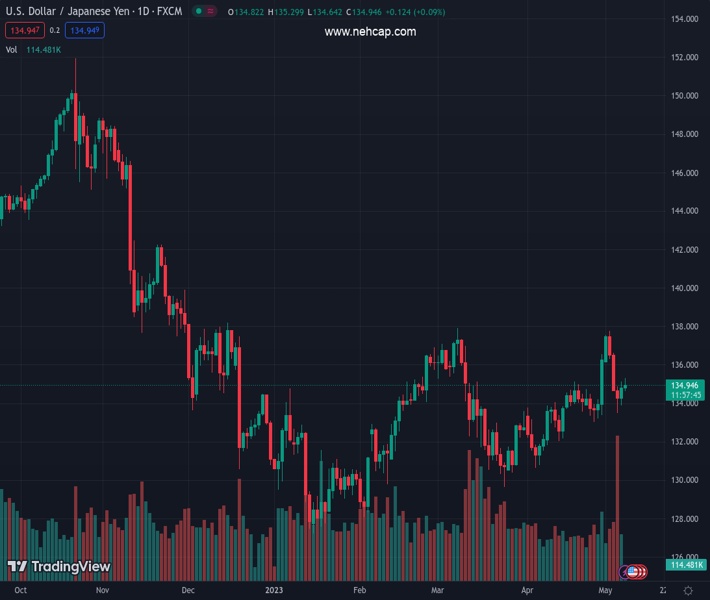
#USDJPY @ 134.975 gains positive traction for the second straight day, albeit lacks bullish conviction. (Pivot Orderbook analysis)
…
This is a premium post.
[s2If !current_user_can(access_s2member_level4)]Please register for FREE REGISTER to read full post below containing analysis. In case of any error or you think you are not able to read the full post below, please email us at support#nehcap.com [lwa][/s2If] [s2If current_user_can(access_s2member_level1)]
- USD/JPY gains positive traction for the second straight day, albeit lacks bullish conviction.
- A combination of factors undermines the safe-haven JPY and acts as a tailwind for the pair.
- Dovish Fed expectations weigh on the USD and keep a lid on any further appreciating move.
The pair currently trades last at 134.975.
The previous day high was 135.12 while the previous day low was 133.88. The daily 38.2% Fib levels comes at 134.65, expected to provide support. Similarly, the daily 61.8% fib level is at 134.36, expected to provide support.
The USD/JPY pair builds on Friday’s positive move and gains some follow-through traction on the first day of a new week, albeit lacks follow-through buying. Spot prices retreat a few pips from a three-day top and trade around the 135.00 psychological mark during the early part of the European session.
The minutes of the last Bank of Japan (BoJ) policy meeting held on March 9-10 showed that members supported the continuation of policy easing in order to achieve steady inflation. Apart from this, a generally positive risk tone undermines the safe-haven Japanese Yen (JPY) and acts as a tailwind for the USD/JPY pair. Some BoJ policymakers, meanwhile, saw positive signs towards achieving the price target and said that the central bank must be vigilant to the risk of inflation accelerating more than expected. This, along with a modest US Dollar (USD) keeps a lid on any meaningful upside for the major, at least for the time being.
In fact, the USD Index (DXY), which tracks the Greenback against a basket of currencies, languishes near the monthly low amid growing acceptance that the Federal Reserve (Fed) is approaching the end of its rate-hiking cycles. Moreover, the markets have been pricing in the possibility that the Fed will cut interest rates during the second half of this year amid signs that the economy is slowing. This, along with concerns about the US banking sector and the debt ceiling, drags the US Treasury bond yields lower and weighs on the buck, which, in turn, acts as a headwind for the USD/JPY pair and warrants caution for bulls.
There isn’t any relevant market-moving economic data due for release from the US on Monday, leaving the USD at the mercy of the US bond yields. Apart from this, the broader risk sentiment might allow traders to grab short-term opportunities around the USD/JPY pair. The focus, however, will remain glued to the latest US consumer inflation figures, due on Wednesday. The crucial US CPI report will play a key role in influencing the Fed’s future interest rate decisions, which should help drive the USD demand in the near term and help investors to determine the next leg of a directional move for the major.
Technical Levels: Supports and Resistances
USDJPY currently trading at 135.01 at the time of writing. Pair opened at 134.83 and is trading with a change of 0.13 % .
| Overview | Overview.1 | |
|---|---|---|
| 0 | Today last price | 135.01 |
| 1 | Today Daily Change | 0.18 |
| 2 | Today Daily Change % | 0.13 |
| 3 | Today daily open | 134.83 |
The pair is trading above its 20 Daily moving average @ 134.41, above its 50 Daily moving average @ 133.88 , above its 100 Daily moving average @ 132.84 and below its 200 Daily moving average @ 136.99
| Trends | Trends.1 | |
|---|---|---|
| 0 | Daily SMA20 | 134.41 |
| 1 | Daily SMA50 | 133.88 |
| 2 | Daily SMA100 | 132.84 |
| 3 | Daily SMA200 | 136.99 |
The previous day high was 135.12 while the previous day low was 133.88. The daily 38.2% Fib levels comes at 134.65, expected to provide support. Similarly, the daily 61.8% fib level is at 134.36, expected to provide support.
Note the levels of interest below:
- Pivot support is noted at 134.1, 133.37, 132.86
- Pivot resistance is noted at 135.34, 135.85, 136.58
| Levels | Levels.1 |
|---|---|
| Previous Daily High | 135.12 |
| Previous Daily Low | 133.88 |
| Previous Weekly High | 137.78 |
| Previous Weekly Low | 133.50 |
| Previous Monthly High | 136.56 |
| Previous Monthly Low | 130.63 |
| Daily Fibonacci 38.2% | 134.65 |
| Daily Fibonacci 61.8% | 134.36 |
| Daily Pivot Point S1 | 134.10 |
| Daily Pivot Point S2 | 133.37 |
| Daily Pivot Point S3 | 132.86 |
| Daily Pivot Point R1 | 135.34 |
| Daily Pivot Point R2 | 135.85 |
| Daily Pivot Point R3 | 136.58 |
[/s2If]
Nehcap Expert Advisor
The NEHCAP MT4 EA is high quality professional trading system geared to generate returns without using GRID or martingales. Each trade has strict risk per trade parameter. The pairs under management include EURUSD, GBPUSD, AUDCAD, AUDNZD,GBPAUD, EURAUD, EURCAD, CHFJPY and many more.
The system is trading live: LIVE ACCOUNT TRACKING
You can run it free. Apply for a free trial and track our account. Buy the system or use profit share mechanism to generate returns on your MT4.
Join Our Telegram Group
")


