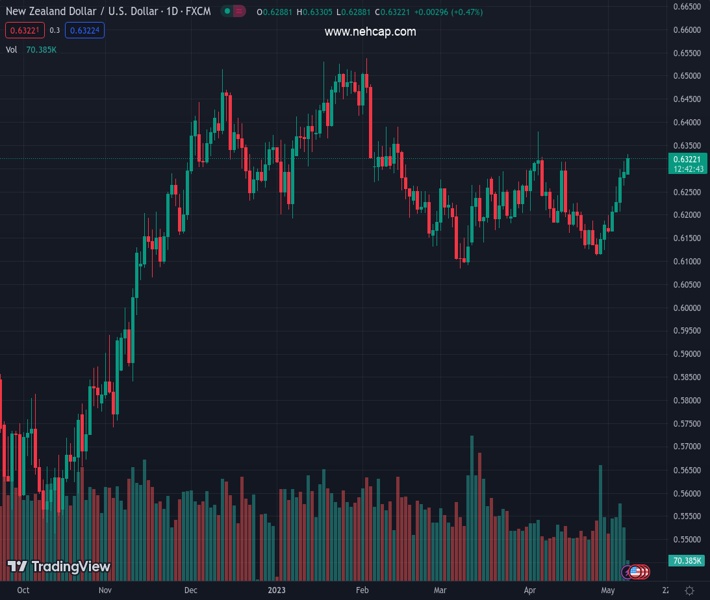
#NZDUSD @ 0.63228 gains traction for the fifth straight day and climbs to over a one-month high. (Pivot Orderbook analysis)
…
This is a premium post.
[s2If !current_user_can(access_s2member_level4)]Please register for FREE REGISTER to read full post below containing analysis. In case of any error or you think you are not able to read the full post below, please email us at support#nehcap.com [lwa][/s2If] [s2If current_user_can(access_s2member_level1)]
- NZD/USD gains traction for the fifth straight day and climbs to over a one-month high.
- The prevalent USD selling bias, along with a positive risk tone, continues to lend support.
- The fundamental backdrop favour of bullish traders ahead of the US CPI on Wednesday.
The pair currently trades last at 0.63228.
The previous day high was 0.6316 while the previous day low was 0.6263. The daily 38.2% Fib levels comes at 0.6284, expected to provide support. Similarly, the daily 61.8% fib level is at 0.6296, expected to provide support.
The NZD/USD pair scales higher for the fifth successive day, also marking the seventh day of a positive move in the previous eight and jumps to over a one-month high on Monday. The pair maintains its bid tone through the early European session and is currently placed around the 0.6325-0.6330 region, up over 0.75% for the day.
The US Dollar (USD) kicks off the new week on a weaker note and remains well within the striking distance of the monthly low touched last Thursday, which, in turn, is seen acting as a tailwind for the NZD/USD pair. Growing acceptance that the Federal Reserve (Fed) is approaching the end of its rate-hiking cycles overshadows the better-than-expected release of the US monthly employment details on Friday. This, along with concerns about the US banking sector and the debt ceiling, keeps the US Treasury bond yields depressed and continues to weigh on the Greenback.
Apart from this, a generally positive tone around the equity markets further undermines the safe-haven buck and benefits the risk-sensitive Kiwi. The New Zealand Dollar (NZD) draw additional support from the upbeat domestic jobs data released last week, which backs the case for further interest rate hikes by the Reserve Bank of New Zealand (RBNZ). Adding to this, hawkish remarks by RBNZ Deputy Governor Christian Hawkesby, saying that the underlying economy has strength and New Zealand banks are well-positioned to support customers, lend support to the NZD/USD pair.
The ongoing strong move up could also be attributed to some technical buying following last week’s sustained breakout through the very important 200-day Simple Moving Average (SMA). This, along with the fact that oscillators on the daily chat are still far from being in the overbought zone, supports prospects for a further near-term appreciating move for the NZD/USD pair. In the absence of any relevant market-moving economic releases from the US, the US bond yields will influence the USD. Apart from this, the broader risk sentiment should provide some impetus on Monday.
The market focus, meanwhile, will remain glued to the release of the latest US consumer inflation figures on Wednesday. Any upside surprise would challenge bets for a rate cut as soon as September and prompt some near-term short-covering around the USD. This, in turn, warrants some caution for aggressive bullish traders and before positioning for any further appreciating move for the NZD/USD pair, at least for the time being.
Technical Levels: Supports and Resistances
NZDUSD currently trading at 0.6327 at the time of writing. Pair opened at 0.6275 and is trading with a change of 0.83 % .
| Overview | Overview.1 | |
|---|---|---|
| 0 | Today last price | 0.6327 |
| 1 | Today Daily Change | 0.0052 |
| 2 | Today Daily Change % | 0.8300 |
| 3 | Today daily open | 0.6275 |
The pair remains strongly bullish on the daily timeframe. It trades above its 20 SMA @ 0.6197, 50 SMA 0.621, 100 SMA @ 0.6279 and 200 SMA @ 0.616.
| Trends | Trends.1 | |
|---|---|---|
| 0 | Daily SMA20 | 0.6197 |
| 1 | Daily SMA50 | 0.6210 |
| 2 | Daily SMA100 | 0.6279 |
| 3 | Daily SMA200 | 0.6160 |
The previous day high was 0.6316 while the previous day low was 0.6263. The daily 38.2% Fib levels comes at 0.6284, expected to provide support. Similarly, the daily 61.8% fib level is at 0.6296, expected to provide support.
Note the levels of interest below:
- Pivot support is noted at 0.6253, 0.6232, 0.62
- Pivot resistance is noted at 0.6306, 0.6338, 0.6359
| Levels | Levels.1 |
|---|---|
| Previous Daily High | 0.6316 |
| Previous Daily Low | 0.6263 |
| Previous Weekly High | 0.6316 |
| Previous Weekly Low | 0.6160 |
| Previous Monthly High | 0.6389 |
| Previous Monthly Low | 0.6111 |
| Daily Fibonacci 38.2% | 0.6284 |
| Daily Fibonacci 61.8% | 0.6296 |
| Daily Pivot Point S1 | 0.6253 |
| Daily Pivot Point S2 | 0.6232 |
| Daily Pivot Point S3 | 0.6200 |
| Daily Pivot Point R1 | 0.6306 |
| Daily Pivot Point R2 | 0.6338 |
| Daily Pivot Point R3 | 0.6359 |
[/s2If]
Nehcap Expert Advisor
The NEHCAP MT4 EA is high quality professional trading system geared to generate returns without using GRID or martingales. Each trade has strict risk per trade parameter. The pairs under management include EURUSD, GBPUSD, AUDCAD, AUDNZD,GBPAUD, EURAUD, EURCAD, CHFJPY and many more.
The system is trading live: LIVE ACCOUNT TRACKING
You can run it free. Apply for a free trial and track our account. Buy the system or use profit share mechanism to generate returns on your MT4.
Join Our Telegram Group
")


