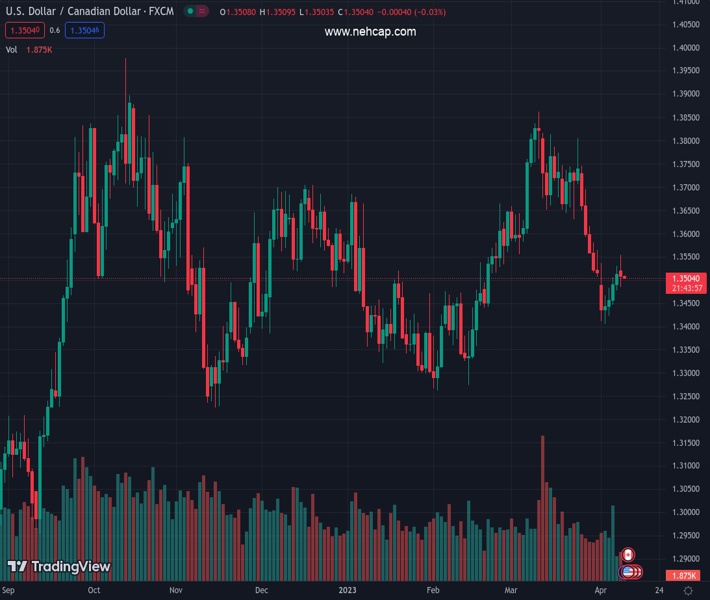
#USDCAD @ 1.35036 is juggling in a narrow range above 1.3500 after a sell-off move ahead of US Inflation. (Pivot Orderbook analysis)
…
This is a premium post.
[s2If !current_user_can(access_s2member_level4)]Please register for PREMIUM VERSION HERE to read full post below containing analysis. In case of any error or you think you are not able to read the full post below, please email us at support#nehcap.com [lwa][/s2If] [s2If current_user_can(access_s2member_level4)]
- USD/CAD is juggling in a narrow range above 1.3500 after a sell-off move ahead of US Inflation.
- BoC Macklem to keep rates steady as Canada’s inflation is softening consistently.
- Investors’ risk appetite is improving as investors are digesting one more rate hike from the Fed.
The pair currently trades last at 1.35036.
The previous day high was 1.3531 while the previous day low was 1.3478. The daily 38.2% Fib levels comes at 1.3511, expected to provide resistance. Similarly, the daily 61.8% fib level is at 1.3498, expected to provide support.
The USD/CAD pair has turned sideways after a perpendicular decline move above the psychological resistance of 1.3500 in the early Tokyo session. The Loonie asset is expected to remain on the tenterhooks ahead of the interest rate decision by the Bank of Canada (BoC) and the United States inflation data, which are scheduled for Wednesday.
BoC Governor Tiff Macklem might stick to its plan of keeping rates steady as Canada’s inflation has been declining consistently.
Investors’ risk appetite is improving as investors are digesting one more rate hike from the Federal Reserve (Fed) in its next month’s policy meeting due to the tight labor market. S&P500 futures have added some gains in early Asia after a recovery move on Monday. The US Dollar Index (DXY) showed a gradual correction after failing to surpass to reclaim the critical resistance of 103.00.
USD/CAD has dropped near the lower portion of the Rising Channel chart pattern formed on an hourly scale. The lower portion of the aforementioned chart pattern is plotted from April 04 low at 1.3406 while the upper portion is placed from April 04 high at 1.3467.
The 20-period Exponential Moving Average (EMA) at 1.3512 is barricading the US Dollar from a recovery.
Meanwhile, the Relative Strength Index (RSI) (14) has slipped back into the 40.00-60.00 range after an attempt of climbing above 60.00, indicating the presence of aggressive sellers at elevated levels.
Should the asset break below April 10 low at 1.3485, Canadian Dollar bulls would further drag the Loonie asset toward April 06 low at 1.3452 followed by April 04 low at 1.3406.
On the contrary, a decisive break above April 10 high at 1.3554 will drive the asset toward the round-level resistance at 1.3600. A breach of the 1.3600 resistance will expose the asset to March 23 low at 1.3630.
Technical Levels: Supports and Resistances
USDCAD currently trading at 1.3505 at the time of writing. Pair opened at 1.3516 and is trading with a change of -0.08 % .
| Overview | Overview.1 | |
|---|---|---|
| 0 | Today last price | 1.3505 |
| 1 | Today Daily Change | -0.0011 |
| 2 | Today Daily Change % | -0.0800 |
| 3 | Today daily open | 1.3516 |
The pair is trading below its 20 Daily moving average @ 1.3621, below its 50 Daily moving average @ 1.3555 , below its 100 Daily moving average @ 1.3529 and above its 200 Daily moving average @ 1.339
| Trends | Trends.1 | |
|---|---|---|
| 0 | Daily SMA20 | 1.3621 |
| 1 | Daily SMA50 | 1.3555 |
| 2 | Daily SMA100 | 1.3529 |
| 3 | Daily SMA200 | 1.3390 |
The previous day high was 1.3531 while the previous day low was 1.3478. The daily 38.2% Fib levels comes at 1.3511, expected to provide resistance. Similarly, the daily 61.8% fib level is at 1.3498, expected to provide support.
Note the levels of interest below:
- Pivot support is noted at 1.3486, 1.3456, 1.3433
- Pivot resistance is noted at 1.3539, 1.3561, 1.3592
| Levels | Levels.1 |
|---|---|
| Previous Daily High | 1.3531 |
| Previous Daily Low | 1.3478 |
| Previous Weekly High | 1.3537 |
| Previous Weekly Low | 1.3406 |
| Previous Monthly High | 1.3862 |
| Previous Monthly Low | 1.3508 |
| Daily Fibonacci 38.2% | 1.3511 |
| Daily Fibonacci 61.8% | 1.3498 |
| Daily Pivot Point S1 | 1.3486 |
| Daily Pivot Point S2 | 1.3456 |
| Daily Pivot Point S3 | 1.3433 |
| Daily Pivot Point R1 | 1.3539 |
| Daily Pivot Point R2 | 1.3561 |
| Daily Pivot Point R3 | 1.3592 |
[/s2If]
Join Our Telegram Group


