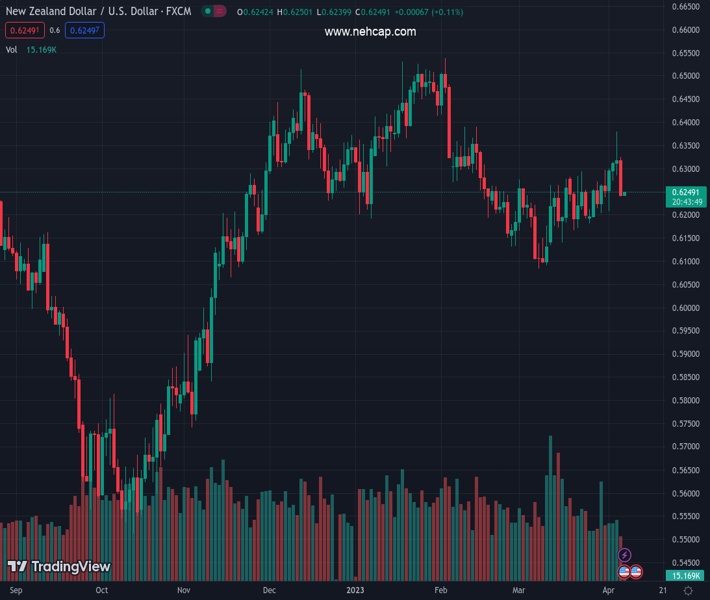
#NZDUSD @ 0.62497 appears well-set for weekly loss after falling the most in a month the previous day. (Pivot Orderbook analysis)
…
This is a premium post.
[s2If !current_user_can(access_s2member_level4)]Please register for PREMIUM VERSION HERE to read full post below containing analysis. In case of any error or you think you are not able to read the full post below, please email us at support#nehcap.com [lwa][/s2If] [s2If current_user_can(access_s2member_level4)]
- NZD/USD appears well-set for weekly loss after falling the most in a month the previous day.
- Sour sentiment allowed Kiwi traders to reverse RBNZ-led rally.
- US data flags recession fears and weigh on commodities, Antipodeans.
- NFP will be crucial, more volatility eyed amid thin market presence.
The pair currently trades last at 0.62497.
The previous day high was 0.6325 while the previous day low was 0.623. The daily 38.2% Fib levels comes at 0.6267, expected to provide resistance. Similarly, the daily 61.8% fib level is at 0.6289, expected to provide resistance.
NZD/USD holds lower grounds near 0.6245-40 amid an inactive Asian session of Good Friday. In doing so, the Kiwi traders take a breather after the quote dropped the most in one month the previous day. Apart from the holiday-driven lack of liquidity, the cautious mood ahead of the US employment data for March also restricts the quote’s immediate moves.
The quote’s latest fall could be linked to the market’s pessimism surrounding the health of the world’s biggest economy, namely the US, and the contagion fears emanating from the same. It’s worth noting, however, that the receding hawkish Fed bets prod the US Dollar from cheering the risk-off mood.
That said, the fears of recession grew after the US Initial Jobless Claims improved to 228K for the week ended on March 31 versus 200K expected and upwardly revised 246K prior. It’s worth noting that the Challenger Job Cuts for the said month rose to 89.703K from 77.77K prior.
The US data has been downbeat since the start, especially relating to employment and activity, which in turn amplified the slowdown fears. Previously, US JOLTS Job Openings dropped to the 19-month low in February while the ADP Employment Change for March also disappointed markets with 145K figures. Further, the US ISM Services PMI for March also amplified pessimism as it dropped to 51.2 versus 54.5 expected and 55.1 prior.
Apart from the US data, the Federal Reserve’s (Fed) preferred gauge of economic health also cited the recession woes and weigh on the NZD/USD prices. “Research from the Fed has argued that the ‘near-term forward spread’ comparing the forward rate on Treasury bills 18 months from now with the current yield on a three-month Treasury bill was the most reliable bond market signal of an imminent economic contraction,” said the news.
At home, the Reserve Bank of New Zealand (RBNZ) bucks the broad trend of pausing the rate hikes and rather surprises the markets with a 0.50% lift to the benchmark rate. As a result, traders became more doubtful of the NZD/USD pair’s previous run-up and drowned the pair afterward with extra strength amid the aforementioned negative catalysts.
Against this backdrop, the Wall Street benchmarks lick their wounds while the US 10-year and two-year Treasury bond yields also stay pressured, despite the latest consolidation around 3.30% and 3.83% in that order. That said, S&P 500 Futures print mild losses amid inactive markets.
Given the holiday-induced lack of action, today’s US jobs report may propel the market’s moves in a wild way, especially due to the recent recession woes and downbeat US data of late. That said, the market expects the headline Nonfarm Payrolls (NFP) to be 240K, down from 311K prior, as well as estimating no change in the Unemployment Rate of 3.6%.
Also read: Nonfarm Payrolls Preview: Markets fear depressing data, three scenarios for the US Dollar
NZD/USD pair’s clear downside break of the one-month-old ascending trend line, around 0.6250 by the press time, keeps bears hopeful.
Technical Levels: Supports and Resistances
NZDUSD currently trading at 0.6245 at the time of writing. Pair opened at 0.6245 and is trading with a change of 0.00% % .
| Overview | Overview.1 | |
|---|---|---|
| 0 | Today last price | 0.6245 |
| 1 | Today Daily Change | 0.0000 |
| 2 | Today Daily Change % | 0.00% |
| 3 | Today daily open | 0.6245 |
The pair is trading above its 20 Daily moving average @ 0.6236, below its 50 Daily moving average @ 0.6263 , below its 100 Daily moving average @ 0.6301 and above its 200 Daily moving average @ 0.616
| Trends | Trends.1 | |
|---|---|---|
| 0 | Daily SMA20 | 0.6236 |
| 1 | Daily SMA50 | 0.6263 |
| 2 | Daily SMA100 | 0.6301 |
| 3 | Daily SMA200 | 0.6160 |
The previous day high was 0.6325 while the previous day low was 0.623. The daily 38.2% Fib levels comes at 0.6267, expected to provide resistance. Similarly, the daily 61.8% fib level is at 0.6289, expected to provide resistance.
Note the levels of interest below:
- Pivot support is noted at 0.6208, 0.6172, 0.6114
- Pivot resistance is noted at 0.6303, 0.6361, 0.6398
| Levels | Levels.1 |
|---|---|
| Previous Daily High | 0.6325 |
| Previous Daily Low | 0.6230 |
| Previous Weekly High | 0.6298 |
| Previous Weekly Low | 0.6180 |
| Previous Monthly High | 0.6298 |
| Previous Monthly Low | 0.6084 |
| Daily Fibonacci 38.2% | 0.6267 |
| Daily Fibonacci 61.8% | 0.6289 |
| Daily Pivot Point S1 | 0.6208 |
| Daily Pivot Point S2 | 0.6172 |
| Daily Pivot Point S3 | 0.6114 |
| Daily Pivot Point R1 | 0.6303 |
| Daily Pivot Point R2 | 0.6361 |
| Daily Pivot Point R3 | 0.6398 |
[/s2If]
Join Our Telegram Group
")


