#USDCAD @ 1.34824 Short term, the is downward biased, and the ongoing upward correction might be capped around 1.3568/75. (Pivot Orderbook analysis)
…
This is a premium post.
[s2If !current_user_can(access_s2member_level4)]Please register for PREMIUM VERSION HERE to read full post below containing analysis. In case of any error or you think you are not able to read the full post below, please email us at support#nehcap.com [lwa][/s2If] [s2If current_user_can(access_s2member_level4)]
- Short term, the USD/CAD is downward biased, and the ongoing upward correction might be capped around 1.3568/75.
- USD/CAD Price Analysis: Further upside potential for USD/CAD lies at 1.3705, December 16 cycle high.
The pair currently trades last at 1.34824.
The previous day high was 1.3484 while the previous day low was 1.3426. The daily 38.2% Fib levels comes at 1.3462, expected to provide support. Similarly, the daily 61.8% fib level is at 1.3448, expected to provide support.
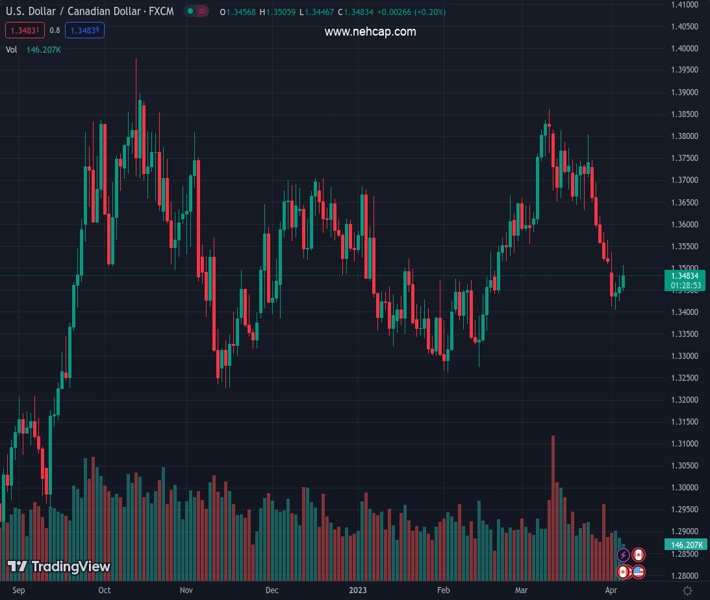
After diving towards 1.3400, the USD/CAD is staging a three-day comeback, though it remains trading above a five-month-old support trendline. At the time of writing, the USD/CAD is trading at 1.3474 after hitting a daily low of 1.3446.
From a daily chart perspective, the USD/CAD is still neutral to upward biased, despite dipping 2.85% since March 24. Nevertheless, buyers kept sellers from testing the 200-day Exponential Moving Average (EMA) at 1.3374 and are hopeful of reclaiming the 100-day EMA at 1.3515. Even though the USD/CAD is printing a leg-up, the USD/CAD advancement could be capped by the 20 and 50-day EMA confluence at around 1.3568/75. If that scenario plays out, the USD/CAD might resume its current downtrend and test the 200-day EMA soon.
On the flip side, for a bullish continuation, the USD/CAD must surpass the 1.3575 area on its way to 1.3600. Once cleared, the USD/CAD upside risks lie at 1.3705, the December 16 cycle high, followed by the March 24 daily high at 1.3804.
Oscillator-wise, the Relative Strength Index (RSI) shifted gears and is aiming north but at bearish territory. This means sellers remain in charge, and the upward correction could be at risk of turning direction. Meanwhile, the Rate of Change (RoC) shows that buyers stepped in but are more likely to be outweighed by sellers.
Technical Levels: Supports and Resistances
USDCAD currently trading at 1.3478 at the time of writing. Pair opened at 1.3457 and is trading with a change of 0.16 % .
| Overview | Overview.1 | |
|---|---|---|
| 0 | Today last price | 1.3478 |
| 1 | Today Daily Change | 0.0021 |
| 2 | Today Daily Change % | 0.1600 |
| 3 | Today daily open | 1.3457 |
The pair is trading below its 20 Daily moving average @ 1.3653, below its 50 Daily moving average @ 1.3547 , below its 100 Daily moving average @ 1.3526 and above its 200 Daily moving average @ 1.3384
| Trends | Trends.1 | |
|---|---|---|
| 0 | Daily SMA20 | 1.3653 |
| 1 | Daily SMA50 | 1.3547 |
| 2 | Daily SMA100 | 1.3526 |
| 3 | Daily SMA200 | 1.3384 |
The previous day high was 1.3484 while the previous day low was 1.3426. The daily 38.2% Fib levels comes at 1.3462, expected to provide support. Similarly, the daily 61.8% fib level is at 1.3448, expected to provide support.
Note the levels of interest below:
- Pivot support is noted at 1.3428, 1.3398, 1.337
- Pivot resistance is noted at 1.3485, 1.3513, 1.3543
| Levels | Levels.1 |
|---|---|
| Previous Daily High | 1.3484 |
| Previous Daily Low | 1.3426 |
| Previous Weekly High | 1.3745 |
| Previous Weekly Low | 1.3508 |
| Previous Monthly High | 1.3862 |
| Previous Monthly Low | 1.3508 |
| Daily Fibonacci 38.2% | 1.3462 |
| Daily Fibonacci 61.8% | 1.3448 |
| Daily Pivot Point S1 | 1.3428 |
| Daily Pivot Point S2 | 1.3398 |
| Daily Pivot Point S3 | 1.3370 |
| Daily Pivot Point R1 | 1.3485 |
| Daily Pivot Point R2 | 1.3513 |
| Daily Pivot Point R3 | 1.3543 |
[/s2If]
Join Our Telegram Group


