#EURUSD @ 1.09345 treads water ahead of key US data inputs. (Pivot Orderbook analysis)
…
This is a premium post.
[s2If !current_user_can(access_s2member_level4)]Please register for PREMIUM VERSION HERE to read full post below containing analysis. In case of any error or you think you are not able to read the full post below, please email us at support#nehcap.com [lwa][/s2If] [s2If current_user_can(access_s2member_level4)]
- EUR/USD treads water ahead of key US data inputs.
- The focus at this point is the pivotal Nonfarm Payrolls.
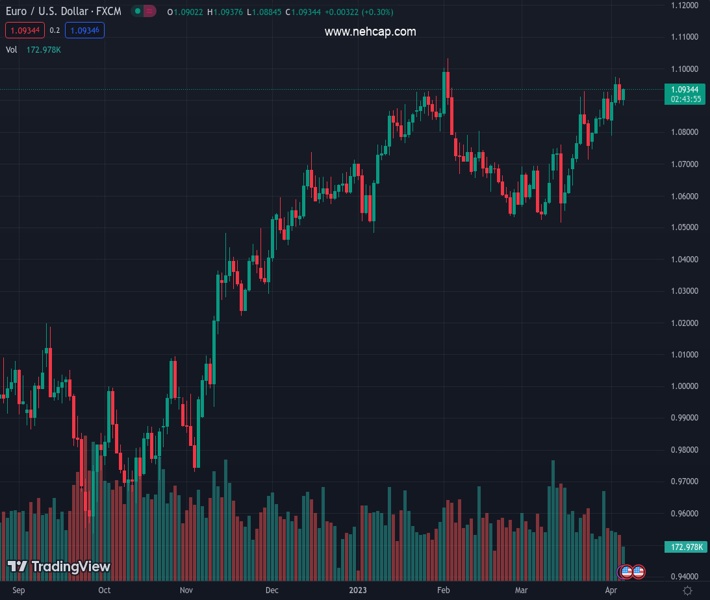
The pair currently trades last at 1.09345.
The previous day high was 1.097 while the previous day low was 1.0891. The daily 38.2% Fib levels comes at 1.0921, expected to provide support. Similarly, the daily 61.8% fib level is at 1.094, expected to provide resistance.
EUR/USD is topping the extreme of the day in late New York in holiday calmness. The pair is currently trading at 1.0930 at hourly resistance. The pair has traveled between a low of 1.0884 and a high of 1.0937. The focus at this point is the pivotal Nonfarm Payrolls and the impact of the Federal Reserve´s policy.
The greenback has been pressured of late following a week of troublesome data. As a prelude, the ADP National Employment report showed US private employers hired fewer workers than expected in March, suggesting a cooling labor market. Private employment increased by 145,000 jobs last month, while economists polled by Reuters had forecast private employment increasing by 200,000, Reuters reported. Additionally, the ISM’s Non-Manufacturing index dropped to 51.2 in March from 55.1 in February. The services sector’s employment indicator slid as well to 45.8 from 47.6 in February.
Looking ahead the focus will be on US inflation and analysts at TD Securities said ´´core prices likely cooled off modestly in March, with the index still rising a strong 0.4% MoM as we look for recent relief from goods deflation to turn into inflation this month.´´
Technical Levels: Supports and Resistances
EURUSD currently trading at 1.0934 at the time of writing. Pair opened at 1.0904 and is trading with a change of 0.28 % .
| Overview | Overview.1 | |
|---|---|---|
| 0 | Today last price | 1.0934 |
| 1 | Today Daily Change | 0.0030 |
| 2 | Today Daily Change % | 0.2800 |
| 3 | Today daily open | 1.0904 |
The pair remains strongly bullish on the daily timeframe. It trades above its 20 SMA @ 1.0773, 50 SMA 1.0733, 100 SMA @ 1.0668 and 200 SMA @ 1.0348.
| Trends | Trends.1 | |
|---|---|---|
| 0 | Daily SMA20 | 1.0773 |
| 1 | Daily SMA50 | 1.0733 |
| 2 | Daily SMA100 | 1.0668 |
| 3 | Daily SMA200 | 1.0348 |
The previous day high was 1.097 while the previous day low was 1.0891. The daily 38.2% Fib levels comes at 1.0921, expected to provide support. Similarly, the daily 61.8% fib level is at 1.094, expected to provide resistance.
Note the levels of interest below:
- Pivot support is noted at 1.0874, 1.0843, 1.0795
- Pivot resistance is noted at 1.0952, 1.1, 1.1031
| Levels | Levels.1 |
|---|---|
| Previous Daily High | 1.0970 |
| Previous Daily Low | 1.0891 |
| Previous Weekly High | 1.0926 |
| Previous Weekly Low | 1.0745 |
| Previous Monthly High | 1.0930 |
| Previous Monthly Low | 1.0516 |
| Daily Fibonacci 38.2% | 1.0921 |
| Daily Fibonacci 61.8% | 1.0940 |
| Daily Pivot Point S1 | 1.0874 |
| Daily Pivot Point S2 | 1.0843 |
| Daily Pivot Point S3 | 1.0795 |
| Daily Pivot Point R1 | 1.0952 |
| Daily Pivot Point R2 | 1.1000 |
| Daily Pivot Point R3 | 1.1031 |
[/s2If]
Join Our Telegram Group


