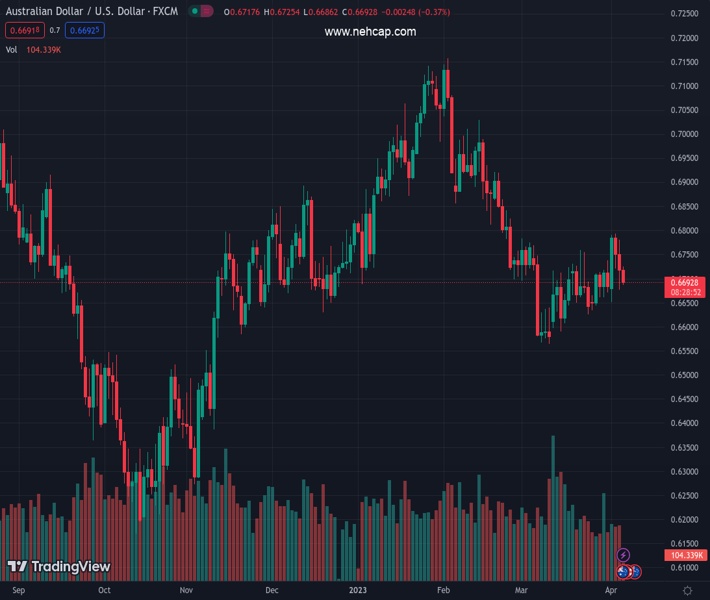
#AUDUSD @ 0.66889 remains depressed for the third straight day and is pressured by a combination of factors. (Pivot Orderbook analysis)
…
This is a premium post.
[s2If !current_user_can(access_s2member_level4)]Please register for PREMIUM VERSION HERE to read full post below containing analysis. In case of any error or you think you are not able to read the full post below, please email us at support#nehcap.com [lwa][/s2If] [s2If current_user_can(access_s2member_level4)]
- AUD/USD remains depressed for the third straight day and is pressured by a combination of factors.
- The RBA’s dovish tilt undermines the Aussie and weighs on the pair amid a modest USD strength.
- Bets for an imminent Fed rate-hike pause act as a headwind for the USD and might help limit losses.
The pair currently trades last at 0.66889.
The previous day high was 0.678 while the previous day low was 0.6677. The daily 38.2% Fib levels comes at 0.6716, expected to provide resistance. Similarly, the daily 61.8% fib level is at 0.6741, expected to provide resistance.
The AUD/USD pair remains under some selling pressure for the third straight day on Thursday and trades just below the 0.6700 round-figure mark heading into the North American session.
The Australian Dollar continues to be weighed down by the Reserve Bank of Australia’s (RBA) dovish outlook, which, along with a modest US Dollar (USD) strength, exerts some downward pressure on the AUD/USD pair. It is worth recalling that the Australian central bank on Tuesday paused its rate-hiking cycle following 10 consecutive raises and signalled that inflation had likely peaked. In the accompanying policy statement, the RBA noted that it wanted additional time to assess the full effects of past increases as the economy slows.
The USD, on the other hand, edges higher for the second straight day and looks to build on the overnight modest bounce from over a two-month low, which is seen as another factor dragging the AUD/USD pair lower. The incoming macro data from the US pointed to slowing economic growth and revived recession fears. This, in turn, continues to weigh on investors’ sentiment and benefits the Greenback’s relative safe-haven status. That said, rising bets for an imminent pause in the Federal Reserve’s (Fed) rate-hike cycle cap gains for the buck.
In fact, the markets are currently pricing in an even chance of a 25 bps lift-off at the next FOMC monetary policy meeting in May and see the possibility of rate cuts by year-end. The bets were lifted by the disappointing US economic releases, which suggested that the Fed’s efforts to cool the labor market could be having some impact. This keeps the US Treasury bond yields depressed near their lowest level in seven months, which is holding back the USD bulls from placing aggressive bets and might limit losses for the AUD/USD pair, at least for now.
The aforementioned mixed fundamental backdrop warrants some caution before positioning for any further depreciating move, though the price action suggests that the path of least resistance for the AUD/USD pair is to the downside. Traders, however, might prefer to move to the sidelines ahead of Friday’s release of the closely-watched US monthly employment details – popularly known as the NFP report. In the meantime, the USD price dynamics will be looked upon to grab some short-term trading opportunities around the major.
Technical Levels: Supports and Resistances
AUDUSD currently trading at 0.669 at the time of writing. Pair opened at 0.672 and is trading with a change of -0.45 % .
| Overview | Overview.1 | |
|---|---|---|
| 0 | Today last price | 0.669 |
| 1 | Today Daily Change | -0.003 |
| 2 | Today Daily Change % | -0.450 |
| 3 | Today daily open | 0.672 |
The pair is trading above its 20 Daily moving average @ 0.6679, below its 50 Daily moving average @ 0.6801 , below its 100 Daily moving average @ 0.68 and below its 200 Daily moving average @ 0.6749
| Trends | Trends.1 | |
|---|---|---|
| 0 | Daily SMA20 | 0.6679 |
| 1 | Daily SMA50 | 0.6801 |
| 2 | Daily SMA100 | 0.6800 |
| 3 | Daily SMA200 | 0.6749 |
The previous day high was 0.678 while the previous day low was 0.6677. The daily 38.2% Fib levels comes at 0.6716, expected to provide resistance. Similarly, the daily 61.8% fib level is at 0.6741, expected to provide resistance.
Note the levels of interest below:
- Pivot support is noted at 0.6672, 0.6623, 0.6568
- Pivot resistance is noted at 0.6775, 0.6829, 0.6878
| Levels | Levels.1 |
|---|---|
| Previous Daily High | 0.6780 |
| Previous Daily Low | 0.6677 |
| Previous Weekly High | 0.6738 |
| Previous Weekly Low | 0.6634 |
| Previous Monthly High | 0.6784 |
| Previous Monthly Low | 0.6564 |
| Daily Fibonacci 38.2% | 0.6716 |
| Daily Fibonacci 61.8% | 0.6741 |
| Daily Pivot Point S1 | 0.6672 |
| Daily Pivot Point S2 | 0.6623 |
| Daily Pivot Point S3 | 0.6568 |
| Daily Pivot Point R1 | 0.6775 |
| Daily Pivot Point R2 | 0.6829 |
| Daily Pivot Point R3 | 0.6878 |
[/s2If]
Join Our Telegram Group


