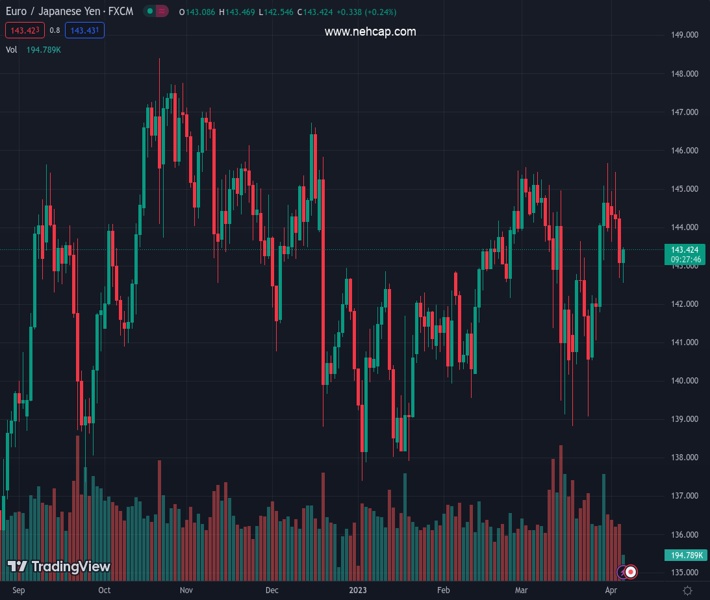
#EURJPY @ 143.399 reverses two sessions with losses and regains 143.00. (Pivot Orderbook analysis)
…
This is a premium post.
[s2If !current_user_can(access_s2member_level4)]Please register for PREMIUM VERSION HERE to read full post below containing analysis. In case of any error or you think you are not able to read the full post below, please email us at support#nehcap.com [lwa][/s2If] [s2If current_user_can(access_s2member_level4)]
- EUR/JPY reverses two sessions with losses and regains 143.00.
- The 200-day SMA continues to hold the downside so far.
The pair currently trades last at 143.399.
The previous day high was 144.45 while the previous day low was 142.67. The daily 38.2% Fib levels comes at 143.35, expected to provide support. Similarly, the daily 61.8% fib level is at 143.77, expected to provide resistance.
EUR/JPY picks up some pace and reclaims the area above 143.00 the figure on Thursday.
The cross keeps navigating choppy waters for the time being. In the meantime, a daily close above the 2023 peak at 145.67 (March 31) should encourage the cross to challenge the December 2022 high around 146.70 (December 15), while the breach of the 200-day SMA at 141.83 exposes a deeper drop to recent lows near 139.00.
So far, further upside looks favoured while the cross trades above the 200-day SMA.
Technical Levels: Supports and Resistances
EURJPY currently trading at 143.28 at the time of writing. Pair opened at 143.06 and is trading with a change of 0.15 % .
| Overview | Overview.1 | |
|---|---|---|
| 0 | Today last price | 143.28 |
| 1 | Today Daily Change | 91.00 |
| 2 | Today Daily Change % | 0.15 |
| 3 | Today daily open | 143.06 |
The pair remains strongly bullish on the daily timeframe. It trades above its 20 SMA @ 142.75, 50 SMA 142.78, 100 SMA @ 142.53 and 200 SMA @ 141.86.
| Trends | Trends.1 | |
|---|---|---|
| 0 | Daily SMA20 | 142.75 |
| 1 | Daily SMA50 | 142.78 |
| 2 | Daily SMA100 | 142.53 |
| 3 | Daily SMA200 | 141.86 |
The previous day high was 144.45 while the previous day low was 142.67. The daily 38.2% Fib levels comes at 143.35, expected to provide support. Similarly, the daily 61.8% fib level is at 143.77, expected to provide resistance.
Note the levels of interest below:
- Pivot support is noted at 142.34, 141.62, 140.56
- Pivot resistance is noted at 144.11, 145.17, 145.89
| Levels | Levels.1 |
|---|---|
| Previous Daily High | 144.45 |
| Previous Daily Low | 142.67 |
| Previous Weekly High | 145.67 |
| Previous Weekly Low | 140.57 |
| Previous Monthly High | 145.67 |
| Previous Monthly Low | 138.83 |
| Daily Fibonacci 38.2% | 143.35 |
| Daily Fibonacci 61.8% | 143.77 |
| Daily Pivot Point S1 | 142.34 |
| Daily Pivot Point S2 | 141.62 |
| Daily Pivot Point S3 | 140.56 |
| Daily Pivot Point R1 | 144.11 |
| Daily Pivot Point R2 | 145.17 |
| Daily Pivot Point R3 | 145.89 |
[/s2If]
Join Our Telegram Group


