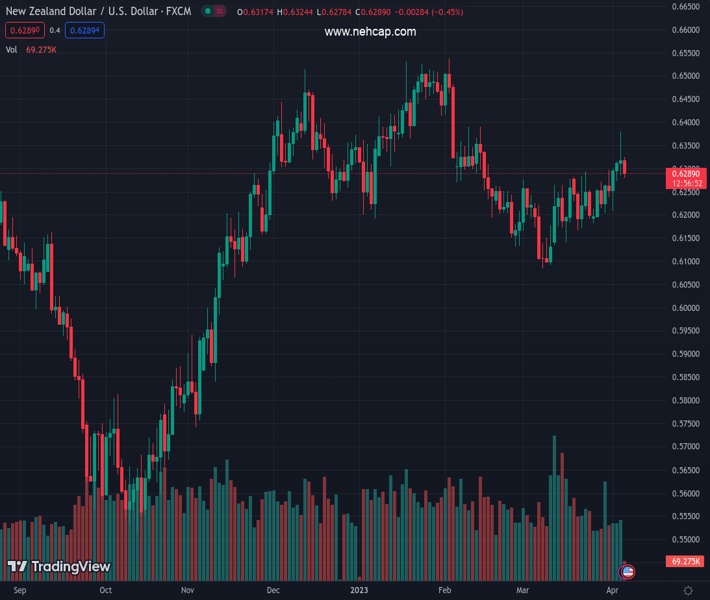
#NZDUSD @ 0.62905 retreats further from a nearly two-month high amid some follow-through USD buying. (Pivot Orderbook analysis)
…
This is a premium post.
[s2If !current_user_can(access_s2member_level4)]Please register for PREMIUM VERSION HERE to read full post below containing analysis. In case of any error or you think you are not able to read the full post below, please email us at support#nehcap.com [lwa][/s2If] [s2If current_user_can(access_s2member_level4)]
- NZD/USD retreats further from a nearly two-month high amid some follow-through USD buying.
- Looming recession fears benefit the safe-haven Greenback and weigh on the risk-sensitive Kiwi.
- Bets for an imminent Fed rate-hike pause could cap the buck and help limit losses for the major.
The pair currently trades last at 0.62905.
The previous day high was 0.6386 while the previous day low was 0.6285. The daily 38.2% Fib levels comes at 0.6348, expected to provide resistance. Similarly, the daily 61.8% fib level is at 0.6324, expected to provide resistance.
The NZD/USD pair comes under heavy selling pressure on Thursday and extends the previous day’s retracement slide from the 0.6400 neighbourhood, or its highest level since February 14. The pair maintains its offered tone through the early part of the European session and is currently placed just below the 0.6300 round-figure mark.
As investors digest the Reserve Bank of New Zealand’s (RBNZ) surprise 50 bps rate hike on Wednesday, some follow-through US Dollar (USD) recovery from over a two-month low is seen exerting downward pressure on the NZD/USD pair. The incoming softer US macro data fuels concerns about a deeper global economic downturn and tempers investors’ appetite for riskier assets. This, in turn, benefits the safe-haven Greenback and is seen weighing on the risk-sensitive Kiwi.
The USD uptick, however, is likely to remain capped amid growing acceptance that the Federal Reserve (Fed) is nearing the end of its rate-hiking cycle. In fact, the markets are currently pricing in an even chance of a 25 bps lift-off at the May FOMC policy meeting and see the possibility of rate cuts by year-end. The bets were lifted by the disappointing US ADP report on Wednesday, which showed that private-sector employers added 145K jobs in March against the 200K anticipated.
Moreover, the ISM Services PMI indicated a slowdown in growth during March, along with a deceleration in its Employment sub-index, suggesting that the Fed’s efforts to cool the labor market could be having some impact. This, in turn, keeps the US Treasury bond yields depressed near their lowest level in seven months, which might hold back traders from placing aggressive bullish bets around the USD and help limit losses for the NZD/USD pair, at least for the time being.
Furthermore, this week’s sustained breakout through a technically significant 200-day Simple Moving Average (SMA) favours bullish traders and supports prospects for the emergence of some dip-buying at lower levels. Hence, it will be prudent to wait for strong follow-through selling before confirming that the NZD/USD pair has formed a near-term top and positioning for any further losses ahead of the release of the closely-watched US monthly jobs data (NFP) on Friday.
Technical Levels: Supports and Resistances
NZDUSD currently trading at 0.6286 at the time of writing. Pair opened at 0.6319 and is trading with a change of -0.52 % .
| Overview | Overview.1 | |
|---|---|---|
| 0 | Today last price | 0.6286 |
| 1 | Today Daily Change | -0.0033 |
| 2 | Today Daily Change % | -0.5200 |
| 3 | Today daily open | 0.6319 |
The pair is trading above its 20 Daily moving average @ 0.6229, above its 50 Daily moving average @ 0.6268 , below its 100 Daily moving average @ 0.63 and above its 200 Daily moving average @ 0.616
| Trends | Trends.1 | |
|---|---|---|
| 0 | Daily SMA20 | 0.6229 |
| 1 | Daily SMA50 | 0.6268 |
| 2 | Daily SMA100 | 0.6300 |
| 3 | Daily SMA200 | 0.6160 |
The previous day high was 0.6386 while the previous day low was 0.6285. The daily 38.2% Fib levels comes at 0.6348, expected to provide resistance. Similarly, the daily 61.8% fib level is at 0.6324, expected to provide resistance.
Note the levels of interest below:
- Pivot support is noted at 0.6274, 0.6229, 0.6173
- Pivot resistance is noted at 0.6375, 0.6431, 0.6476
| Levels | Levels.1 |
|---|---|
| Previous Daily High | 0.6386 |
| Previous Daily Low | 0.6285 |
| Previous Weekly High | 0.6298 |
| Previous Weekly Low | 0.6180 |
| Previous Monthly High | 0.6298 |
| Previous Monthly Low | 0.6084 |
| Daily Fibonacci 38.2% | 0.6348 |
| Daily Fibonacci 61.8% | 0.6324 |
| Daily Pivot Point S1 | 0.6274 |
| Daily Pivot Point S2 | 0.6229 |
| Daily Pivot Point S3 | 0.6173 |
| Daily Pivot Point R1 | 0.6375 |
| Daily Pivot Point R2 | 0.6431 |
| Daily Pivot Point R3 | 0.6476 |
[/s2If]
Join Our Telegram Group


