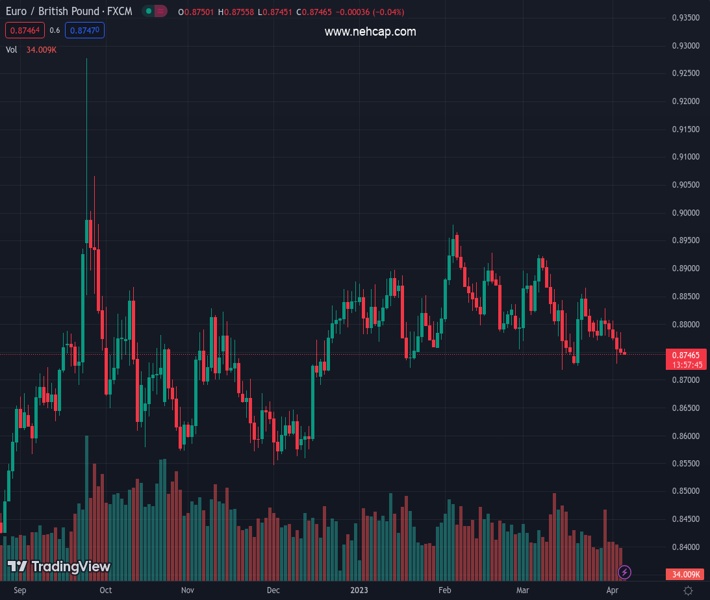
#EURGBP @ 0.87486 retreats from intraday high during six-day downtrend. (Pivot Orderbook analysis)
…
This is a premium post.
[s2If !current_user_can(access_s2member_level4)]Please register for PREMIUM VERSION HERE to read full post below containing analysis. In case of any error or you think you are not able to read the full post below, please email us at support#nehcap.com [lwa][/s2If] [s2If current_user_can(access_s2member_level4)]
- EUR/GBP retreats from intraday high during six-day downtrend.
- German Industrial Production YoY for February arrives better than expected and prior.
- Brexit optimism, comparatively upbeat UK data and hawkish BoE talks previously teased bears.
- ECB policymakers keep advocating further rate hikes even as recession fears loom.
The pair currently trades last at 0.87486.
The previous day high was 0.8786 while the previous day low was 0.8745. The daily 38.2% Fib levels comes at 0.8761, expected to provide resistance. Similarly, the daily 61.8% fib level is at 0.877, expected to provide resistance.
EUR/GBP fails to cheer upbeat German data for long during early Thursday as it reverses from the intraday top to around 0.8745 by the press time. In doing so, the cross-currency pair drops for the sixth consecutive day and remains on the way to posting the second consecutive weekly loss as traders brace for the holidays in the bloc.
Germany’s Industrial Production (IP) rose 0.6% YoY in February versus -2.7% market forecasts and -1.6% previous readings. The monthly figures also came in firmer than 0.1% expected, to 2.0% versus 3.7% prior.
Today’s German data traces the previous day’s mostly upbeat figures for the European powerhouse, as well as for the old continent, and allow the Euro buyers to cheer the recently hawkish comments from the European Central Bank (ECB) officials. However, the broad risk-off mood and recession fears underpin the US Dollar’s demand and weigh on the shared currency.
On Wednesday, Germany Factory Orders improved to -5.7% YoY for February from -12.0 revised down prior and -10.5% market forecasts while the MoM growth came in at 4.8% compared to 0.3% expected and 0.5% previous readings. It’s worth noting that Germany’s final readings of S&P GlobalBME Composite PMI for March confirmed 52.6 initial estimations while Services PMI eased to 53.7 versus 53.9 flash forecasts. On a broader front, Eurozone S&P Global Composite PMI eased to 53.7 in March versus 54.1 first readings whereas Services PMI also declined to 55.0 during the stated month from 55.6 preliminary forecasts.
Following the data, ECB policymaker Boris Vujčić said on Wednesday, “The largest part of the rate-hiking cycle is behind us.” The ECB official also added that “to address core inflation, we might need to raise rates further.”
It’s worth noting, however, that the Brexit optimism and the UK’s mixed PMIs seem to challenge the EUR/GBP buyers.
The UK’s final readings of S&P Global/CIPS Composite and Services PMIs for March came in mixed as the former confirmed the initial estimations of 52.2 but the key Services gauge improved to 52.9 from 52.8 initial forecasts.
Talking about Brexit, “A new model will be announced later on Wednesday to ‘reduce the need for checks for many types of goods,’” said Sky News while citing an anonymous UK Cabinet Office source speaking on the post-Brexit checks on goods coming to the UK from the European Union (EU).
Moving on, second-tier Eurozone data can entertain EUR/GBP pair traders ahead of a Good Friday break. With this, the cross-currency pair may witness further consolidation of previous losses but the bulls need strong reasons to return.
Despite the latest rebound, EUR/GBP buyers need to cross a three-week-old previous support line, now immediate resistance near 0.8770, to retake control. Until then, the bears appear to keep the reins and aim for the 11-week-old horizontal support area surrounding 0.8720.
Technical Levels: Supports and Resistances
EURGBP currently trading at 0.8754 at the time of writing. Pair opened at 0.8752 and is trading with a change of 0.02% % .
| Overview | Overview.1 | |
|---|---|---|
| 0 | Today last price | 0.8754 |
| 1 | Today Daily Change | 0.0002 |
| 2 | Today Daily Change % | 0.02% |
| 3 | Today daily open | 0.8752 |
The pair is trading below its 20 Daily moving average @ 0.8797, below its 50 Daily moving average @ 0.8832 , below its 100 Daily moving average @ 0.8782 and above its 200 Daily moving average @ 0.8696
| Trends | Trends.1 | |
|---|---|---|
| 0 | Daily SMA20 | 0.8797 |
| 1 | Daily SMA50 | 0.8832 |
| 2 | Daily SMA100 | 0.8782 |
| 3 | Daily SMA200 | 0.8696 |
The previous day high was 0.8786 while the previous day low was 0.8745. The daily 38.2% Fib levels comes at 0.8761, expected to provide resistance. Similarly, the daily 61.8% fib level is at 0.877, expected to provide resistance.
Note the levels of interest below:
- Pivot support is noted at 0.8736, 0.8721, 0.8696
- Pivot resistance is noted at 0.8777, 0.8801, 0.8817
| Levels | Levels.1 |
|---|---|
| Previous Daily High | 0.8786 |
| Previous Daily Low | 0.8745 |
| Previous Weekly High | 0.8828 |
| Previous Weekly Low | 0.8771 |
| Previous Monthly High | 0.8925 |
| Previous Monthly Low | 0.8718 |
| Daily Fibonacci 38.2% | 0.8761 |
| Daily Fibonacci 61.8% | 0.8770 |
| Daily Pivot Point S1 | 0.8736 |
| Daily Pivot Point S2 | 0.8721 |
| Daily Pivot Point S3 | 0.8696 |
| Daily Pivot Point R1 | 0.8777 |
| Daily Pivot Point R2 | 0.8801 |
| Daily Pivot Point R3 | 0.8817 |
[/s2If]
Join Our Telegram Group


