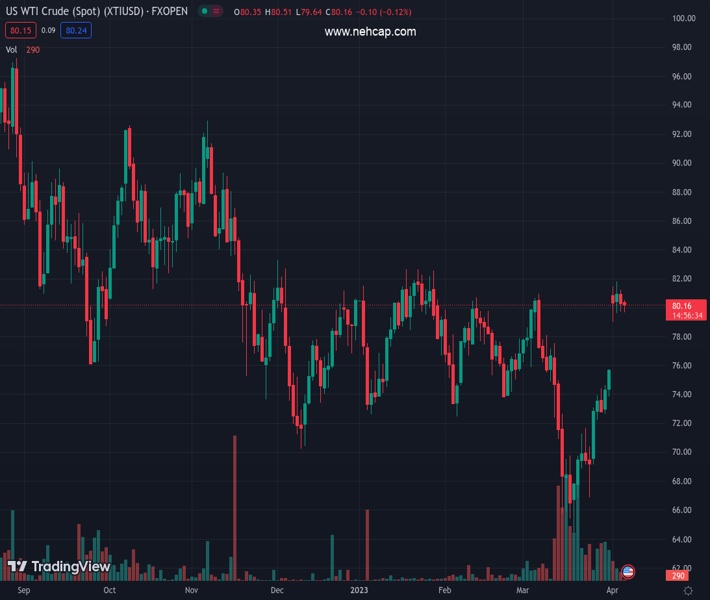
WTI fades bounce off intraday low, down for the second consecutive day to pare weekly gains around multi-day top. (Pivot Orderbook analysis)
…
This is a premium post.
[s2If !current_user_can(access_s2member_level4)]Please register for PREMIUM VERSION HERE to read full post below containing analysis. In case of any error or you think you are not able to read the full post below, please email us at support#nehcap.com [lwa][/s2If] [s2If current_user_can(access_s2member_level4)]
- WTI fades bounce off intraday low, down for the second consecutive day to pare weekly gains around multi-day top.
- Fears emanating from China, North Korea join recession woes to favor US Dollar’s haven demand.
- Easy inventory draw adds strength to pullback moves.
- OPEC+ supply cut, downbeat US statistics keep Oil buyers hopeful.
The pair currently trades last at 80.11.
The previous day high was 81.25 while the previous day low was 79.75. The daily 38.2% Fib levels comes at 80.32, expected to provide resistance. Similarly, the daily 61.8% fib level is at 80.67, expected to provide resistance.
WTI crude oil drops for the second consecutive day after refreshing a seven-week high, down 0.50% near $79.95 heading into Thursday’s European session. In doing so, the black gold justifies the US Dollar’s corrective bounce amid sour sentiment to trim gains during the third consecutive weekly uptrend.
US Dollar Index (DXY) rises 0.12% intraday to 102.00 as it extends the previous day’s rebound from a two-month low despite the recent dovish shift in the Fed bets and downbeat US data. The reason for the US Dollar’s latest rebound could be linked to the market’s fears of a recession in the world’s largest economy after the US employment clues have been extremely downbeat.
Apart from the recession fears, the US-China tension about a likely meeting between US House of Representatives Speaker Kevin McCarthy and Taiwanese President Tsai Ing-Wen also weighs on the sentiment and allow the US Dollar to grind high. On the same line is the latest nuclear warning from North Korea as the US and South Korea hold joint military drills.
On a different page, a lesser-than-previous inventory draw also weighs on the WTI crude oil prices. That said, the weekly stockpile data from the US Energy Information Administration (EIA) marked -3.739M figure versus -2.329M market forecasts and -7.489M prior. Previously, the American Petroleum Institute (API) also flashed downbeat inventory data for the week ended on March 31, -4.346M versus -6.076M prior.
Alternatively, the OPEC+ supply cut and the market’s bets on no Fed action in May month may seem to put a floor under the Oil prices.
Amid these plays, S&P 500 Futures drop for the third consecutive day even if the benchmark US Treasury bond yields remain sluggish around the multi-day bottom.
Moving on, the second-tier US data may entertain Oil traders ahead of Friday’s all-important Nonfarm Payrolls (NFP).
A clear downside break of a fortnight-old support line, around $79.40 at the latest, becomes necessary for the WTI crude oil bears to return to the table.
Technical Levels: Supports and Resistances
XTIUSD currently trading at 80.11 at the time of writing. Pair opened at 80.36 and is trading with a change of -0.31% % .
| Overview | Overview.1 | |
|---|---|---|
| 0 | Today last price | 80.11 |
| 1 | Today Daily Change | -0.25 |
| 2 | Today Daily Change % | -0.31% |
| 3 | Today daily open | 80.36 |
The pair is trading above its 20 Daily moving average @ 72.98, above its 50 Daily moving average @ 75.76 , above its 100 Daily moving average @ 76.81 and below its 200 Daily moving average @ 83.21
| Trends | Trends.1 | |
|---|---|---|
| 0 | Daily SMA20 | 72.98 |
| 1 | Daily SMA50 | 75.76 |
| 2 | Daily SMA100 | 76.81 |
| 3 | Daily SMA200 | 83.21 |
The previous day high was 81.25 while the previous day low was 79.75. The daily 38.2% Fib levels comes at 80.32, expected to provide resistance. Similarly, the daily 61.8% fib level is at 80.67, expected to provide resistance.
Note the levels of interest below:
- Pivot support is noted at 79.66, 78.95, 78.16
- Pivot resistance is noted at 81.16, 81.95, 82.66
| Levels | Levels.1 |
|---|---|
| Previous Daily High | 81.25 |
| Previous Daily Low | 79.75 |
| Previous Weekly High | 75.78 |
| Previous Weekly Low | 69.18 |
| Previous Monthly High | 80.99 |
| Previous Monthly Low | 64.39 |
| Daily Fibonacci 38.2% | 80.32 |
| Daily Fibonacci 61.8% | 80.67 |
| Daily Pivot Point S1 | 79.66 |
| Daily Pivot Point S2 | 78.95 |
| Daily Pivot Point S3 | 78.16 |
| Daily Pivot Point R1 | 81.16 |
| Daily Pivot Point R2 | 81.95 |
| Daily Pivot Point R3 | 82.66 |
[/s2If]
Join Our Telegram Group


