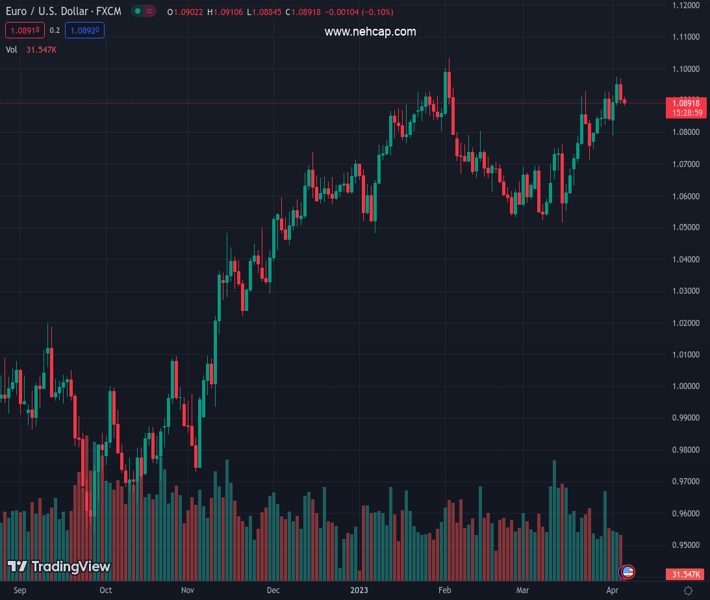
#EURUSD @ 1.08924 holds lower ground after confirming a bearish chart formation, sidelined of late., @nehcap view: Further downside expected (Pivot Orderbook analysis)
…
This is a premium post.
[s2If !current_user_can(access_s2member_level4)]Please register for PREMIUM VERSION HERE to read full post below containing analysis. In case of any error or you think you are not able to read the full post below, please email us at support#nehcap.com [lwa][/s2If] [s2If current_user_can(access_s2member_level4)]
- EUR/USD holds lower ground after confirming a bearish chart formation, sidelined of late.
- Recovery remains elusive below 1.0950 even as MACD signals test Euro sellers of late.
- 200-HMA, fortnight-old support line can act as intermediate halt during theoretical south-run targeting 1.0790.
The pair currently trades last at 1.08924.
The previous day high was 1.097 while the previous day low was 1.0891. The daily 38.2% Fib levels comes at 1.0921, expected to provide resistance. Similarly, the daily 61.8% fib level is at 1.094, expected to provide resistance.
EUR/USD prints mild losses around 1.0890 during the two-day downtrend heading into Thursday’s European session. In doing so, the Euro pair extends the previous day’s pullback from a two-month high after confirming a bearish “Head and Shoulders” (H&S) chart pattern on the hourly play.
It’s worth noting, however, that a light calendar and receding strength of the bearish MACD signals seem to challenge the EUR/USD sellers of late.
The Euro pair remains on the bear’s radar unless crossing the 1.0900 support-turned-resistance, comprising the neckline of the stated H&S formation.
Following that, a one-week-old ascending resistance line around 1.0950 can act as the last defense of the EUR/USD bears before targeting the latest swing high of 1.0975.
Should the EUR/USD buyers keep the reins past 1.0975, the 1.1000 psychological magnet and the Year-To-Date (YTD) high of 1.1033 will be in focus.
Alternatively, the 200-Hour Moving Average (HMA) precedes a two-week-long ascending trend line to restrict short-term EUR/USD downside around 1.0865 and 1.0830 in that order.
It’s worth observing that the H&S confirmation flashes the theoretical target of 1.0790 which is near the weekly bottom.
Hence, EUR/USD is well-set for further declines despite the latest inaction.
Trend: Further downside expected
Technical Levels: Supports and Resistances
EURUSD currently trading at 1.0892 at the time of writing. Pair opened at 1.0904 and is trading with a change of -0.11 % .
| Overview | Overview.1 | |
|---|---|---|
| 0 | Today last price | 1.0892 |
| 1 | Today Daily Change | -0.0012 |
| 2 | Today Daily Change % | -0.1100 |
| 3 | Today daily open | 1.0904 |
The pair remains strongly bullish on the daily timeframe. It trades above its 20 SMA @ 1.0773, 50 SMA 1.0733, 100 SMA @ 1.0668 and 200 SMA @ 1.0348.
| Trends | Trends.1 | |
|---|---|---|
| 0 | Daily SMA20 | 1.0773 |
| 1 | Daily SMA50 | 1.0733 |
| 2 | Daily SMA100 | 1.0668 |
| 3 | Daily SMA200 | 1.0348 |
The previous day high was 1.097 while the previous day low was 1.0891. The daily 38.2% Fib levels comes at 1.0921, expected to provide resistance. Similarly, the daily 61.8% fib level is at 1.094, expected to provide resistance.
Note the levels of interest below:
- Pivot support is noted at 1.0874, 1.0843, 1.0795
- Pivot resistance is noted at 1.0952, 1.1, 1.1031
| Levels | Levels.1 |
|---|---|
| Previous Daily High | 1.0970 |
| Previous Daily Low | 1.0891 |
| Previous Weekly High | 1.0926 |
| Previous Weekly Low | 1.0745 |
| Previous Monthly High | 1.0930 |
| Previous Monthly Low | 1.0516 |
| Daily Fibonacci 38.2% | 1.0921 |
| Daily Fibonacci 61.8% | 1.0940 |
| Daily Pivot Point S1 | 1.0874 |
| Daily Pivot Point S2 | 1.0843 |
| Daily Pivot Point S3 | 1.0795 |
| Daily Pivot Point R1 | 1.0952 |
| Daily Pivot Point R2 | 1.1000 |
| Daily Pivot Point R3 | 1.1031 |
[/s2If]
Join Our Telegram Group


