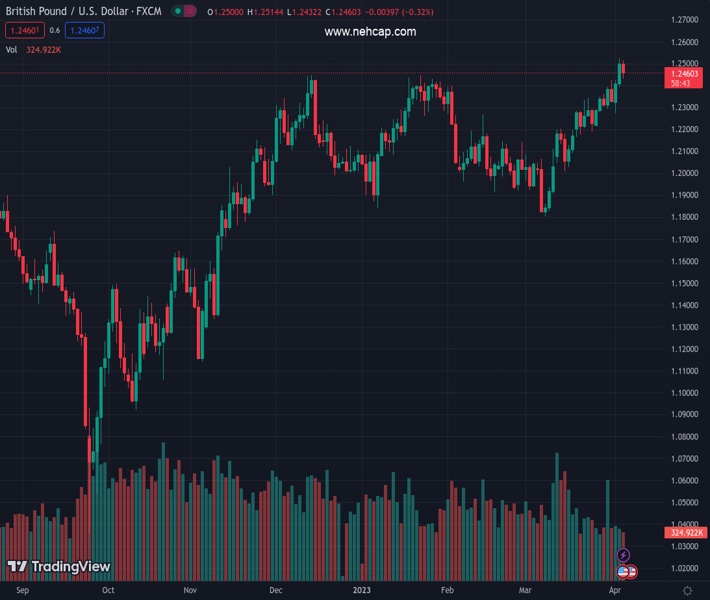
#GBPUSD @ 1.24570 is forming a bearish-harami candlestick pattern with bearish implications. (Pivot Orderbook analysis)
…
This is a premium post.
[s2If !current_user_can(access_s2member_level4)]Please register for PREMIUM VERSION HERE to read full post below containing analysis. In case of any error or you think you are not able to read the full post below, please email us at support#nehcap.com [lwa][/s2If] [s2If current_user_can(access_s2member_level4)]
- GBP/USD is forming a bearish-harami candlestick pattern with bearish implications.
- Private hiring and business activity in the US missed estimates as economic growth decelerated.
- Business activity in the UK expands, though inflation remains at double digits.
The pair currently trades last at 1.24570.
The previous day high was 1.2525 while the previous day low was 1.2395. The daily 38.2% Fib levels comes at 1.2476, expected to provide resistance. Similarly, the daily 61.8% fib level is at 1.2445, expected to provide support.
GBP/USD faces strong resistance at around 1.2500 and retraces due to risk aversion as investors assess a possible recession in the United States (US). The latest US economic data paints a gloomy scenario, which is already foreseen by the US Federal Reserve (Fed) as the last piece of the puzzle, the larbor market, showed signs of slowing down. The GBPUSD trades at 1.2459, down by 0.33%.
US equities continue to tumble across the board. The ISM revealed its non-manufacturing index, which rose by 51.2, below estimates and the prior’s month data. Earlier, private hiring in the US, as reported by ADP in collaboration with Stanford Digital Economy Lab, jumped to 145K, below the 200K consensus.
After the release of the figures, the GBP/USD seesawed in an extensive 70-pip range, from 1.2505-1.2432, before stabilizing around 1.2450. As business activity slows down, recessionary fears are growing amongst investors.
Aside from this, money market futures continued to price in that the US central bank, the Federal Reserve (Fed) would keep rates unchanged at their May meeting.
Source: CME FedWatch Tool
Aside from this, the UK economic docket featured the S$P Global/CIPS Services PMI, which came at 52.9, below estimates but at expansionary territory. However, fundamentally speaking, inflation in the UK remains at double-digit figures, though per the latest Bank of England (BoE) Monetary Policy Report (MPR), the central bank expected inflation to drop “significantly in Q2 2023.” That said, investors have begun to price in a less hawkish BoE, and for the next monetary policy meeting, odds for a no change sit at 54.5%.
From a technical perspective, the GBP/USD appears to have peaked at around 1.2500. A daily close at current exchange rates would confirm the formation of a bearish-harami two-candlesticks pattern, suggesting further downside is expected. If GBP/USD tumbles below Tuesday’s low of 1.2394, the pair’s next support would be the 20-day EMA at 1.2276, followed by the psychological 1.2200 mark. Downside risks lie at the 50-day EMA.
Technical Levels: Supports and Resistances
GBPUSD currently trading at 1.246 at the time of writing. Pair opened at 1.2502 and is trading with a change of -0.34 % .
| Overview | Overview.1 | |
|---|---|---|
| 0 | Today last price | 1.2460 |
| 1 | Today Daily Change | -0.0042 |
| 2 | Today Daily Change % | -0.3400 |
| 3 | Today daily open | 1.2502 |
The pair remains strongly bullish on the daily timeframe. It trades above its 20 SMA @ 1.2217, 50 SMA 1.2153, 100 SMA @ 1.2143 and 200 SMA @ 1.1897.
| Trends | Trends.1 | |
|---|---|---|
| 0 | Daily SMA20 | 1.2217 |
| 1 | Daily SMA50 | 1.2153 |
| 2 | Daily SMA100 | 1.2143 |
| 3 | Daily SMA200 | 1.1897 |
The previous day high was 1.2525 while the previous day low was 1.2395. The daily 38.2% Fib levels comes at 1.2476, expected to provide resistance. Similarly, the daily 61.8% fib level is at 1.2445, expected to provide support.
Note the levels of interest below:
- Pivot support is noted at 1.2423, 1.2344, 1.2293
- Pivot resistance is noted at 1.2553, 1.2604, 1.2683
| Levels | Levels.1 |
|---|---|
| Previous Daily High | 1.2525 |
| Previous Daily Low | 1.2395 |
| Previous Weekly High | 1.2424 |
| Previous Weekly Low | 1.2219 |
| Previous Monthly High | 1.2424 |
| Previous Monthly Low | 1.1803 |
| Daily Fibonacci 38.2% | 1.2476 |
| Daily Fibonacci 61.8% | 1.2445 |
| Daily Pivot Point S1 | 1.2423 |
| Daily Pivot Point S2 | 1.2344 |
| Daily Pivot Point S3 | 1.2293 |
| Daily Pivot Point R1 | 1.2553 |
| Daily Pivot Point R2 | 1.2604 |
| Daily Pivot Point R3 | 1.2683 |
[/s2If]
Join Our Telegram Group


