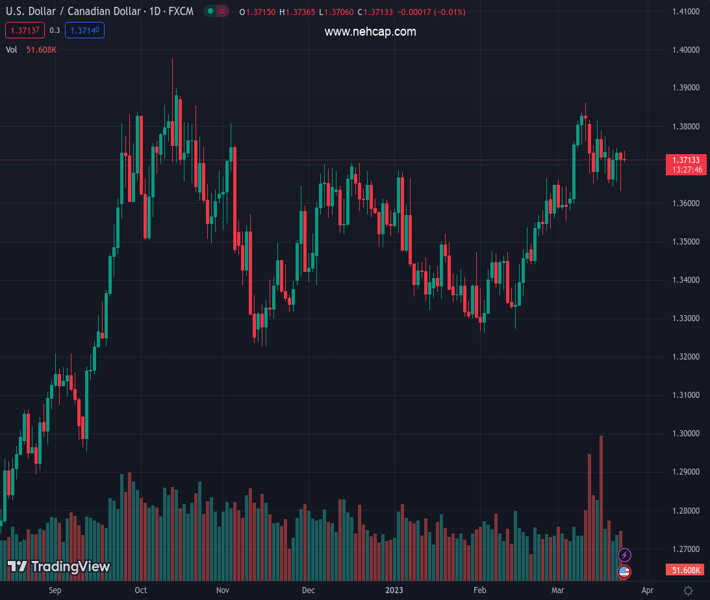
#USDCAD @ 1.37188 oscillates in a narrow trading band and is influenced by a combination of forces. (Pivot Orderbook analysis)
…
This is a premium post.
[s2If !current_user_can(access_s2member_level4)]Please register for PREMIUM VERSION HERE to read full post below containing analysis. In case of any error or you think you are not able to read the full post below, please email us at support#nehcap.com [lwa][/s2If] [s2If current_user_can(access_s2member_level4)]
- USD/CAD oscillates in a narrow trading band and is influenced by a combination of forces.
- An uptick in Oil prices underpins the Loonie and caps the upside amid subdued USD demand.
- Traders look forward to important macro data from the US and Canada for a fresh impetus.
The pair currently trades last at 1.37188.
The previous day high was 1.3734 while the previous day low was 1.3631. The daily 38.2% Fib levels comes at 1.367, expected to provide support. Similarly, the daily 61.8% fib level is at 1.3695, expected to provide support.
The USD/CAD pair struggles to capitalize on the previous day’s goodish rebound from the 1.3630 area, or over a two-week low and oscillates in a narrow trading band through the early European session on Friday. The pair is currently placed just above the 1.3700 mark, though a combination of factors keeps a lid on any meaningful upside.
Crude Oil prices regain positive traction amid fears that rising tensions in the Middle East could disrupt supply, especially after a US air strike on Iran-backed groups. This, in turn, underpins the commodity-linked Loonie, which, along with subdued US Dollar (USD) price action, acts as a headwind for the USD/CAD pair. The Federal Reserve’s hint of a pause to interest rate hikes fails to assist the Greenback to build on the overnight recovery move from its lowest level since February 03.
It is worth recalling that the US central bank raised interest rates by 25 bps on Wednesday, as was widely anticipated, though sounded cautious on the outlook in the wake of the recent turmoil in the banking sector. This comes on the back of the recent sudden collapse of two mid-size US banks – Silicon Valley Bank and Signature Bank. The Fed also lowered its median forecast for real GDP growth projections for 2023 and 2024, which keeps the US Treasury bond yields and the USD depressed.
Apart from this, a generally positive tone around the equity markets is seen as another factor weighing on the safe-haven buck. That said, growing market concerns that slowing economic growth will dent fuel demand should cap the upside for Oil prices. This, along with expectations that the Bank of Canada (BoC) refrain from raising interest rates any further, bolstered by the softer-than-expected Canadian consumer inflation released on Tuesday, should lend support to the USD/CAD pair.
From a technical perspective, the two-way price moves within a familiar range witnessed since the beginning of the current week point to indecision among traders over the near-term trajectory. Furthermore, the aforementioned mixed fundamental backdrop warrants some caution before placing aggressive directional bets around the USD/CAD pair. Investors also seem reluctant ahead of important macro data from the US and Canada, due later during the early North American session.
Friday’s US economic docket features the release of Durable Goods Orders and the flash PMI prints, which, along with the US bond yields and the broader risk sentiment, will influence the USD demand. Traders will further take cues from Canadian monthly Retail Sales figures. Apart from this, Oil price dynamics should provide a fresh impetus to the USD/CAD pair and produce short-term opportunities on the last day of the week.
Technical Levels: Supports and Resistances
USDCAD currently trading at 1.3717 at the time of writing. Pair opened at 1.3715 and is trading with a change of 0.01 % .
| Overview | Overview.1 | |
|---|---|---|
| 0 | Today last price | 1.3717 |
| 1 | Today Daily Change | 0.0002 |
| 2 | Today Daily Change % | 0.0100 |
| 3 | Today daily open | 1.3715 |
The pair remains strongly bullish on the daily timeframe. It trades above its 20 SMA @ 1.3695, 50 SMA 1.3522, 100 SMA @ 1.3511 and 200 SMA @ 1.3356.
| Trends | Trends.1 | |
|---|---|---|
| 0 | Daily SMA20 | 1.3695 |
| 1 | Daily SMA50 | 1.3522 |
| 2 | Daily SMA100 | 1.3511 |
| 3 | Daily SMA200 | 1.3356 |
The previous day high was 1.3734 while the previous day low was 1.3631. The daily 38.2% Fib levels comes at 1.367, expected to provide support. Similarly, the daily 61.8% fib level is at 1.3695, expected to provide support.
Note the levels of interest below:
- Pivot support is noted at 1.3652, 1.359, 1.3549
- Pivot resistance is noted at 1.3756, 1.3797, 1.386
| Levels | Levels.1 |
|---|---|
| Previous Daily High | 1.3734 |
| Previous Daily Low | 1.3631 |
| Previous Weekly High | 1.3828 |
| Previous Weekly Low | 1.3652 |
| Previous Monthly High | 1.3666 |
| Previous Monthly Low | 1.3262 |
| Daily Fibonacci 38.2% | 1.3670 |
| Daily Fibonacci 61.8% | 1.3695 |
| Daily Pivot Point S1 | 1.3652 |
| Daily Pivot Point S2 | 1.3590 |
| Daily Pivot Point S3 | 1.3549 |
| Daily Pivot Point R1 | 1.3756 |
| Daily Pivot Point R2 | 1.3797 |
| Daily Pivot Point R3 | 1.3860 |
[/s2If]
Join Our Telegram Group
")


