#USDJPY @ 130.459 prints three-day losing streak to refresh multi-day low, bounces off daily low at the latest., @nehcap view: Further downside expected (Pivot Orderbook analysis)
…
This is a premium post.
[s2If !current_user_can(access_s2member_level4)]Please register for PREMIUM VERSION HERE to read full post below containing analysis. In case of any error or you think you are not able to read the full post below, please email us at support#nehcap.com [lwa][/s2If] [s2If current_user_can(access_s2member_level4)]
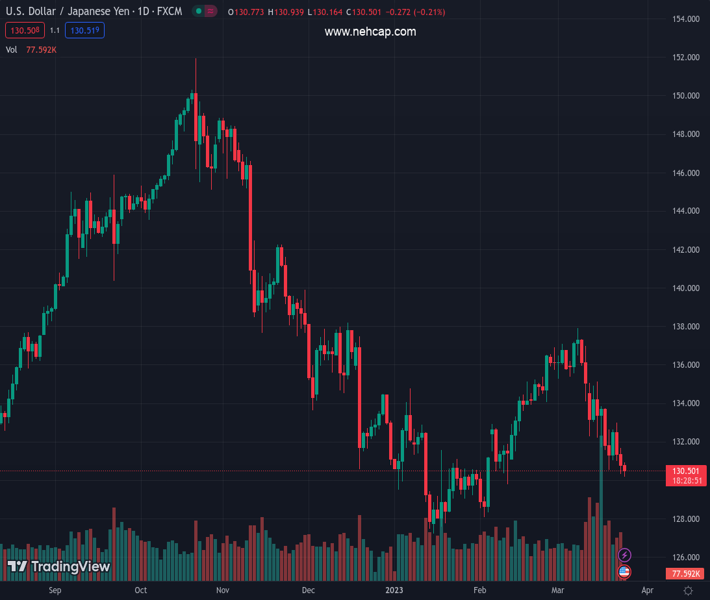
- USD/JPY prints three-day losing streak to refresh multi-day low, bounces off daily low at the latest.
- Sustained trading below 50-DMA, bearish MACD signals favor sellers.
- Yen pair’s recovery remains elusive below five-week-long horizontal resistance.
The pair currently trades last at 130.459.
The previous day high was 131.66 while the previous day low was 130.32. The daily 38.2% Fib levels comes at 130.83, expected to provide resistance. Similarly, the daily 61.8% fib level is at 131.15, expected to provide resistance.
USD/JPY licks its wounds near 130.60, after refreshing a 1.5-month low, during a three-day downtrend on early Friday. In doing so, the Yen pair sellers attack the support line stretched from early January while extending the mid-week pullback from the 50-DMA.
In addition to the pair’s inability to cross the 50-DMA, around 132.60 by the press time, the bearish MACD signals also weigh on the quote and suggest the downside break of the immediate support line, close to 130.50 at the latest.
Following that, the 130.00 round figure and multiple levels marked in February near 129.30, as well as near 128.00, could test the USD/JPY bears before directing them to the yearly low of 127.21.
It’s worth noting, however, that the Yen pair’s sustained weakness past 127.21, could make it vulnerable to testing the 61.8% Fibonacci Expansion (FE) of its moves between October 2022 and March 2023, near 122.50.
Alternatively, USD/JPY recovery can initially aim for the 50-DMA hurdle of 132.60. However, a horizontal area comprising multiple tops marked since February 17, close to 135.20, appears a tough nut to crack for the bulls afterward.
In a case where the Yen pair remains firmer past 135.20, the odds of witnessing a fresh monthly high, currently around 137.90, can’t be ruled out.
Trend: Further downside expected
Technical Levels: Supports and Resistances
USDJPY currently trading at 130.59 at the time of writing. Pair opened at 130.83 and is trading with a change of -0.18% % .
| Overview | Overview.1 | |
|---|---|---|
| 0 | Today last price | 130.59 |
| 1 | Today Daily Change | -0.24 |
| 2 | Today Daily Change % | -0.18% |
| 3 | Today daily open | 130.83 |
The pair remains strongly bearish on the daily time frame. It trades below the 20 SMA @ 134.57, 50 SMA 132.55, 100 SMA @ 134.61 and 200 SMA @ 137.43.
| Trends | Trends.1 | |
|---|---|---|
| 0 | Daily SMA20 | 134.57 |
| 1 | Daily SMA50 | 132.55 |
| 2 | Daily SMA100 | 134.61 |
| 3 | Daily SMA200 | 137.43 |
The previous day high was 131.66 while the previous day low was 130.32. The daily 38.2% Fib levels comes at 130.83, expected to provide resistance. Similarly, the daily 61.8% fib level is at 131.15, expected to provide resistance.
Note the levels of interest below:
- Pivot support is noted at 130.21, 129.6, 128.87
- Pivot resistance is noted at 131.55, 132.28, 132.89
| Levels | Levels.1 |
|---|---|
| Previous Daily High | 131.66 |
| Previous Daily Low | 130.32 |
| Previous Weekly High | 135.12 |
| Previous Weekly Low | 131.56 |
| Previous Monthly High | 136.92 |
| Previous Monthly Low | 128.08 |
| Daily Fibonacci 38.2% | 130.83 |
| Daily Fibonacci 61.8% | 131.15 |
| Daily Pivot Point S1 | 130.21 |
| Daily Pivot Point S2 | 129.60 |
| Daily Pivot Point S3 | 128.87 |
| Daily Pivot Point R1 | 131.55 |
| Daily Pivot Point R2 | 132.28 |
| Daily Pivot Point R3 | 132.89 |
[/s2If]
Join Our Telegram Group
")


