#EURUSD @ 1.09124 picks up bids to extend six-day uptrend towards two-month high., @nehcap view: Limited upside expected (Pivot Orderbook analysis)
…
This is a premium post.
[s2If !current_user_can(access_s2member_level4)]Please register for PREMIUM VERSION HERE to read full post below containing analysis. In case of any error or you think you are not able to read the full post below, please email us at support#nehcap.com [lwa][/s2If] [s2If current_user_can(access_s2member_level4)]
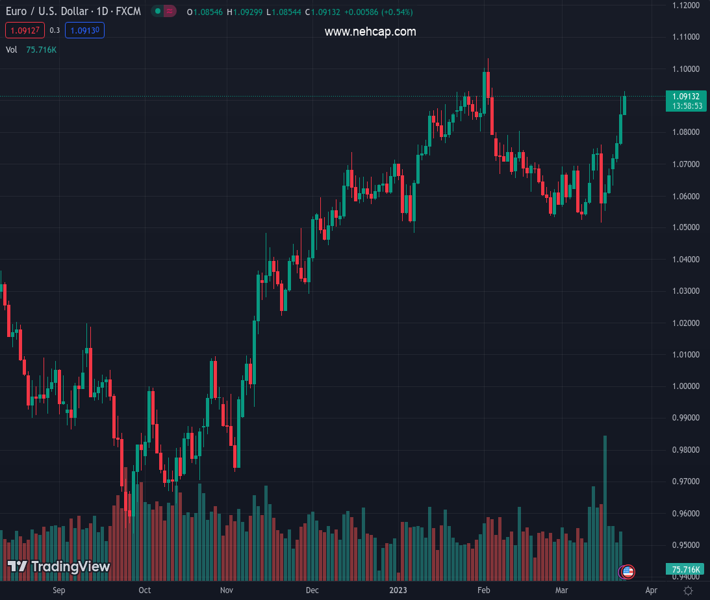
- EUR/USD picks up bids to extend six-day uptrend towards two-month high.
- Multiple hurdles marched since late January challenge Euro pair buyers.
- Sellers need validation 200-SMA, weekly support line restricts immediate downside.
- MACD favors bulls but RSI (14) line suggests limited room towards the north.
The pair currently trades last at 1.09124.
The previous day high was 1.0912 while the previous day low was 1.0759. The daily 38.2% Fib levels comes at 1.0854, expected to provide support. Similarly, the daily 61.8% fib level is at 1.0818, expected to provide support.
EUR/USD bulls occupy the driver’s seat for the sixth consecutive day as they prod 1.0930 mark to renew a seven-week high during early Thursday.
In doing so, the Euro pair extends the Federal Reserve (Fed) inspired gains during the one-week-old upward trajectory, as marked by an ascending trend line from March 15, amid bullish MACD signals.
However, a two-month-old horizontal resistance area surrounding 1.0930-35 joins the overbought RSI (14) line to challenge the EUR/USD buyers.
Hence, it becomes necessary for the pair to provide a successful break of 1.0930 to keep the bulls in dominating position otherwise the bears could cheer good profits on a U-turn.
It should be noted that a downward-sloping resistance line from May 2022, around 1.0950 by the press time, also acts as a short-term upside filter for the EUR/USD pair.
That said, a sustained break of 1.0950 could quickly propel the EUR/USD price toward the monthly high of 1.1033. However, the 1.1000 psychological magnet may act as an intermediate halt during the run-up.
On the flip side, a one-week-old ascending support line, close to 1.0800, puts a floor under the EUR/USD price.
However, the pair sellers should remain cautious unless the quote remains beyond the 200-SMA support of 1.0665.
Trend: Limited upside expected
Technical Levels: Supports and Resistances
EURUSD currently trading at 1.0925 at the time of writing. Pair opened at 1.0856 and is trading with a change of 0.64% % .
| Overview | Overview.1 | |
|---|---|---|
| 0 | Today last price | 1.0925 |
| 1 | Today Daily Change | 0.0069 |
| 2 | Today Daily Change % | 0.64% |
| 3 | Today daily open | 1.0856 |
The pair remains strongly bullish on the daily timeframe. It trades above its 20 SMA @ 1.0644, 50 SMA 1.0731, 100 SMA @ 1.0597 and 200 SMA @ 1.0331.
| Trends | Trends.1 | |
|---|---|---|
| 0 | Daily SMA20 | 1.0644 |
| 1 | Daily SMA50 | 1.0731 |
| 2 | Daily SMA100 | 1.0597 |
| 3 | Daily SMA200 | 1.0331 |
The previous day high was 1.0912 while the previous day low was 1.0759. The daily 38.2% Fib levels comes at 1.0854, expected to provide support. Similarly, the daily 61.8% fib level is at 1.0818, expected to provide support.
Note the levels of interest below:
- Pivot support is noted at 1.0772, 1.0689, 1.0619
- Pivot resistance is noted at 1.0926, 1.0996, 1.1079
| Levels | Levels.1 |
|---|---|
| Previous Daily High | 1.0912 |
| Previous Daily Low | 1.0759 |
| Previous Weekly High | 1.0760 |
| Previous Weekly Low | 1.0516 |
| Previous Monthly High | 1.1033 |
| Previous Monthly Low | 1.0533 |
| Daily Fibonacci 38.2% | 1.0854 |
| Daily Fibonacci 61.8% | 1.0818 |
| Daily Pivot Point S1 | 1.0772 |
| Daily Pivot Point S2 | 1.0689 |
| Daily Pivot Point S3 | 1.0619 |
| Daily Pivot Point R1 | 1.0926 |
| Daily Pivot Point R2 | 1.0996 |
| Daily Pivot Point R3 | 1.1079 |
[/s2If]
Join Our Telegram Group


