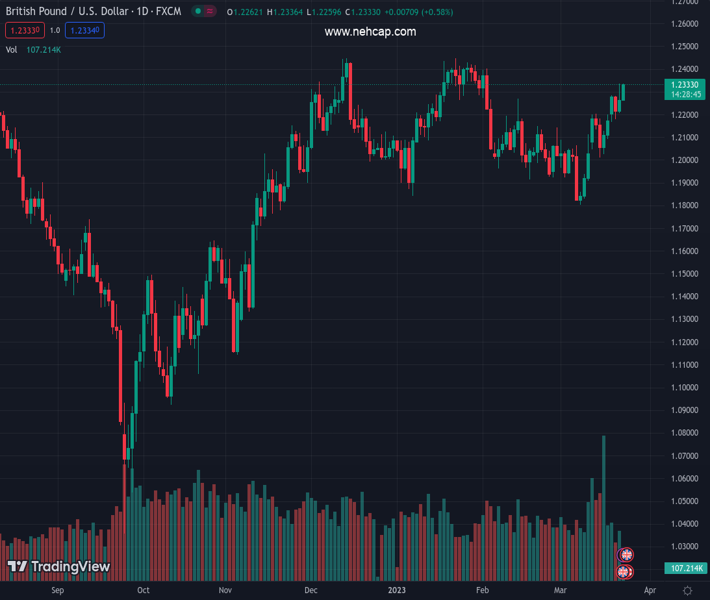
#GBPUSD @ 1.23322 has printed a fresh day’s high at 1.2330 as the USD index has continued its downside journey. (Pivot Orderbook analysis)
…
This is a premium post.
[s2If !current_user_can(access_s2member_level4)]Please register for PREMIUM VERSION HERE to read full post below containing analysis. In case of any error or you think you are not able to read the full post below, please email us at support#nehcap.com [lwa][/s2If] [s2If current_user_can(access_s2member_level4)]
- GBP/USD has printed a fresh day’s high at 1.2330 as the USD index has continued its downside journey.
- The cable is auctioning in a Rising Channel chart pattern in which every pullback is considered as a buying opportunity.
- A range shift move by the RSI (14) into the bullish territory of 40.00-80.00 cement more upside ahead.
The pair currently trades last at 1.23322.
The previous day high was 1.2336 while the previous day low was 1.2209. The daily 38.2% Fib levels comes at 1.2287, expected to provide support. Similarly, the daily 61.8% fib level is at 1.2257, expected to provide support.
The GBP/USD pair has printed a fresh day high at 1.2330 in the early European session. The upside bias for Cable is backed by further weakness in the US Dollar Index (DXY) as the Federal Reserve (Fed) is approaching the phase of policy-tightening. Also, rising hawkish bets for Bank of England (BoE) policy after a surprise jump in the United Kingdom inflation is supporting the Pound Sterling.
Economists at Bank of America Global Research (BoA) are expecting a 25bp BoE rate hike, with dovish guidance.
The USD Index is struggling to sustain above 102.00 and is expected to extend its downside journey as the spotlight has shifted to risk-perceived assets. S&P500 futures have recovered firmly, indicating some revival in the risk appetite of the market participants.
GBP/USD is auctioning in a Rising Channel chart pattern on a four-hour scale in which every pullback is considered as a buying opportunity by the market participants. The Cable is marching towards the horizontal resistance plotted from December 13 high at 1.2444.
The 20-period Exponential Moving Average (EMA) at 1.2245 is providing cushion to the Pound Sterling bulls.
A range shift move by the Relative Strength into the bullish arena of 40.00-80.00 from the bearish region of 20.00-60.00 indicates more upside ahead.
The Cable has already shown a stellar rally, therefore, a mean-reversion move to near 10-period EMA 1.2275 would be an optimal opportunity for making fresh long. This will drive the asset toward December 05 high at 1.2345 followed by the horizontal resistance plotted from December 13 high at 1.2444.
On the flip side, a breakdown below March 21 low at 1.2212 would drag the Cable toward the round-level support around 1.2100 and March 15 low around 1.2000.
Technical Levels: Supports and Resistances
GBPUSD currently trading at 1.2329 at the time of writing. Pair opened at 1.2265 and is trading with a change of 0.52 % .
| Overview | Overview.1 | |
|---|---|---|
| 0 | Today last price | 1.2329 |
| 1 | Today Daily Change | 0.0064 |
| 2 | Today Daily Change % | 0.5200 |
| 3 | Today daily open | 1.2265 |
The pair remains strongly bullish on the daily timeframe. It trades above its 20 SMA @ 1.2057, 50 SMA 1.2146, 100 SMA @ 1.2073 and 200 SMA @ 1.1894.
| Trends | Trends.1 | |
|---|---|---|
| 0 | Daily SMA20 | 1.2057 |
| 1 | Daily SMA50 | 1.2146 |
| 2 | Daily SMA100 | 1.2073 |
| 3 | Daily SMA200 | 1.1894 |
The previous day high was 1.2336 while the previous day low was 1.2209. The daily 38.2% Fib levels comes at 1.2287, expected to provide support. Similarly, the daily 61.8% fib level is at 1.2257, expected to provide support.
Note the levels of interest below:
- Pivot support is noted at 1.2204, 1.2143, 1.2077
- Pivot resistance is noted at 1.2331, 1.2397, 1.2458
| Levels | Levels.1 |
|---|---|
| Previous Daily High | 1.2336 |
| Previous Daily Low | 1.2209 |
| Previous Weekly High | 1.2204 |
| Previous Weekly Low | 1.2010 |
| Previous Monthly High | 1.2402 |
| Previous Monthly Low | 1.1915 |
| Daily Fibonacci 38.2% | 1.2287 |
| Daily Fibonacci 61.8% | 1.2257 |
| Daily Pivot Point S1 | 1.2204 |
| Daily Pivot Point S2 | 1.2143 |
| Daily Pivot Point S3 | 1.2077 |
| Daily Pivot Point R1 | 1.2331 |
| Daily Pivot Point R2 | 1.2397 |
| Daily Pivot Point R3 | 1.2458 |
[/s2If]
Join Our Telegram Group


