Asian stocks are demonstrating a subdued performance amid mixed responses toward Fed policy. (Pivot Orderbook analysis)
…
This is a premium post.
[s2If !current_user_can(access_s2member_level4)]Please register for PREMIUM VERSION HERE to read full post below containing analysis. In case of any error or you think you are not able to read the full post below, please email us at support#nehcap.com [lwa][/s2If] [s2If current_user_can(access_s2member_level4)]
- Asian stocks are demonstrating a subdued performance amid mixed responses toward Fed policy.
- Fed’s battle against inflation continues as it won’t cut rates this year and also claims one more rate hike.
- Oil prices are aiming to sustain above $70.00 despite a build-up of inventories last week.
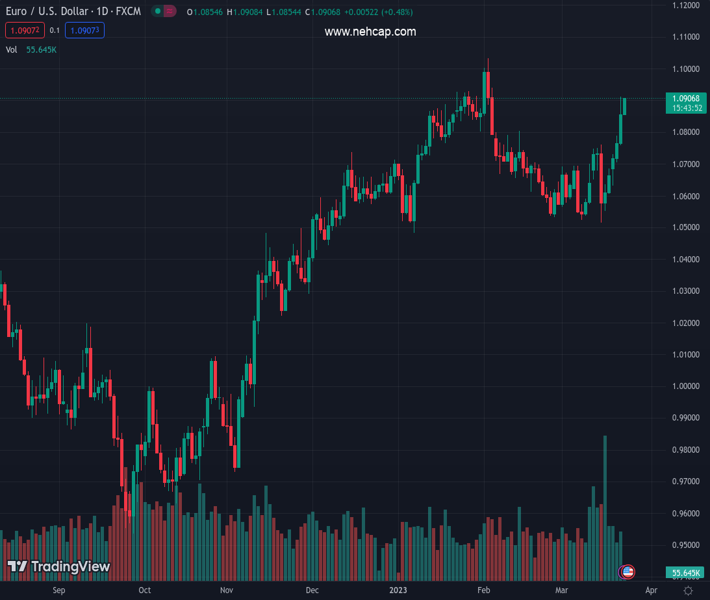
The pair currently trades last at 27255.03.
The previous day high was 27610.59 while the previous day low was 27199.22. The daily 38.2% Fib levels comes at 27356.36, expected to provide resistance. Similarly, the daily 61.8% fib level is at 27453.45, expected to provide resistance.
Markets in the Asian domain are displaying subdued performance on Thursday as investors are still digesting distinct commentaries from Federal Reserve (Fed) chair Jerome Powell while delivering a monetary policy statement.
Asian equities are confused about whether to cheer signals of a rate-hike pause or to outrage on potential credit tightening from US banks to remain cautious after the collapse of three mid-size US banks in one week. Tightening credit conditions from US banks might impact advances to households and businesses. This could also impact the outflow of funds to developing Asian nations.
Fed Powell has continued its heroic battle against persistent inflation claiming that one more rate hike is on cards and the central bank won’t cut rates this year.
At the press time, Japan’s Nikkei225 eased 0.27% while ChinaA50 jumped 0.27% and Hang Seng climbed 0.80%. Meanwhile, Nifty50 remains choppy.
The US Dollar Index (DXY) looks vulnerable above 102.00 and is likely to display more downside as safe-haven assets are losing charm led by expectations of a few rate hikes are further required by the Fed to scale US Consumer Price Index (CPI) to 2%.
Japanese stocks are likely to remain on tenterhooks ahead of the inflation data, which will release on Friday. According to the consensus, annual headline CPI is expected to decline to 4.1% from the former release of 4.3%. While the core CPI that strips off oil and food prices is seen higher at 3.4% against the prior release of 3.2%.
On the oil front, oil price is aiming to sustain above $70.00 amid optimism about fewer rate hikes from the Fed. This has receded fears of deep recession but further contraction in economic activities cannot be ruled out. Apart from that, investors have ignored the build-up of oil inventories last week. The US Energy Information Administration (EIA) reported a build-up of oil stockpiles by 1.117 million barrels for the week ending March 17.
Technical Levels: Supports and Resistances
EURUSD currently trading at 27255.03 at the time of writing. Pair opened at 27255.03 and is trading with a change of 0.0 % .
| Overview | Overview.1 | |
|---|---|---|
| 0 | Today last price | 27255.03 |
| 1 | Today Daily Change | 0.00 |
| 2 | Today Daily Change % | 0.00 |
| 3 | Today daily open | 27255.03 |
The pair remains strongly bearish on the daily time frame. It trades below the 20 SMA @ 27582.18, 50 SMA 27372.42, 100 SMA @ 27339.47 and 200 SMA @ 27335.68.
| Trends | Trends.1 | |
|---|---|---|
| 0 | Daily SMA20 | 27582.18 |
| 1 | Daily SMA50 | 27372.42 |
| 2 | Daily SMA100 | 27339.47 |
| 3 | Daily SMA200 | 27335.68 |
The previous day high was 27610.59 while the previous day low was 27199.22. The daily 38.2% Fib levels comes at 27356.36, expected to provide resistance. Similarly, the daily 61.8% fib level is at 27453.45, expected to provide resistance.
Note the levels of interest below:
- Pivot support is noted at 27099.3, 26943.58, 26687.93
- Pivot resistance is noted at 27510.67, 27766.32, 27922.04
| Levels | Levels.1 |
|---|---|
| Previous Daily High | 27610.59 |
| Previous Daily Low | 27199.22 |
| Previous Weekly High | 27921.99 |
| Previous Weekly Low | 26446.43 |
| Previous Monthly High | 27812.68 |
| Previous Monthly Low | 26985.47 |
| Daily Fibonacci 38.2% | 27356.36 |
| Daily Fibonacci 61.8% | 27453.45 |
| Daily Pivot Point S1 | 27099.30 |
| Daily Pivot Point S2 | 26943.58 |
| Daily Pivot Point S3 | 26687.93 |
| Daily Pivot Point R1 | 27510.67 |
| Daily Pivot Point R2 | 27766.32 |
| Daily Pivot Point R3 | 27922.04 |
[/s2If]
Join Our Telegram Group


