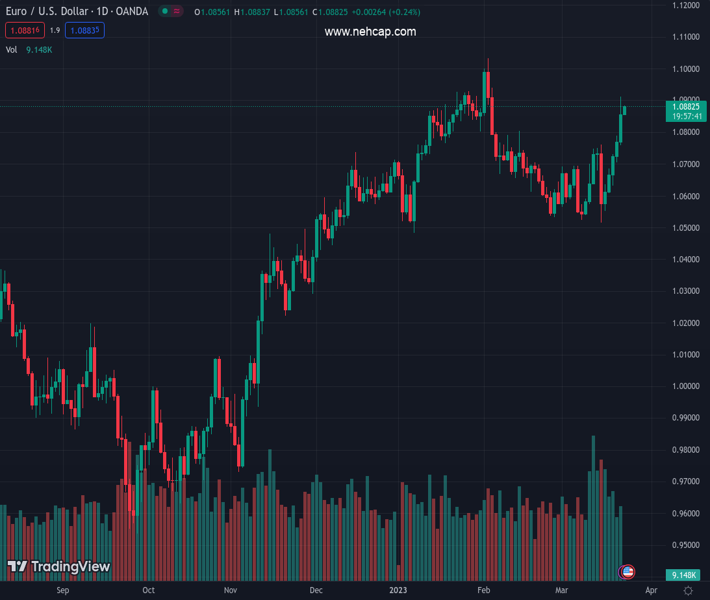
#EURUSD @ 1.08824 prints six-day winning streak, stays firmer around the highest levels since early February., @nehcap view: Further upside expected (Pivot Orderbook analysis)
…
This is a premium post.
[s2If !current_user_can(access_s2member_level4)]Please register for PREMIUM VERSION HERE to read full post below containing analysis. In case of any error or you think you are not able to read the full post below, please email us at support#nehcap.com [lwa][/s2If] [s2If current_user_can(access_s2member_level4)]
- EUR/USD prints six-day winning streak, stays firmer around the highest levels since early February.
- Clear upside break of one-year-long horizontal resistance, now support, joins upbeat oscillators to favor Euro bulls.
- Sustained bounce off 100-DMA, 50% Fibonacci retracement also strength bullish bias.
- Sellers need validation from 200-DMA to retake control.
The pair currently trades last at 1.08824.
The previous day high was 1.0912 while the previous day low was 1.0759. The daily 38.2% Fib levels comes at 1.0854, expected to provide support. Similarly, the daily 61.8% fib level is at 1.0818, expected to provide support.
EUR/USD picks up bids to refresh intraday high near 1.0875 as bulls keep the reins for the sixth consecutive day to early Thursday. In doing so, the major currency pair remains firmer around the highest levels in seven weeks, marked the previous day.
That said, the quote’s upside momentum gains validation from a successful break of the one-year-long horizontal resistance, now support around 1.0805-785.
Also favoring the bulls is the EUR/USD pair’s sustained rebound from the 100-DMA, around 1.0605 by the press time, as well as from the 50% Fibonacci retracement of the pair’s downside from February to September 2022, near 1.0515.
Additionally, bullish MACD signals and the firmer Relative Strength Index (RSI) line, not overbought, also underpin the bullish bias about the EUR/USD pair.
It should be noted that the 200-DMA level surrounding 1.0335 acts as the last defense of the EUR/USD buyers.
On the flip side, a 13-month-old descending resistance line, around 1.0985, lures the EUR/USD bulls ahead of the 1.1000 psychological magnet. Following that, the yearly high of 1.1033 and the March 2022 top surrounding 1.1185 could lure the pair buyers.
Trend: Further upside expected
Technical Levels: Supports and Resistances
EURUSD currently trading at 1.0874 at the time of writing. Pair opened at 1.0856 and is trading with a change of 0.17% % .
| Overview | Overview.1 | |
|---|---|---|
| 0 | Today last price | 1.0874 |
| 1 | Today Daily Change | 0.0018 |
| 2 | Today Daily Change % | 0.17% |
| 3 | Today daily open | 1.0856 |
The pair remains strongly bullish on the daily timeframe. It trades above its 20 SMA @ 1.0644, 50 SMA 1.0731, 100 SMA @ 1.0597 and 200 SMA @ 1.0331.
| Trends | Trends.1 | |
|---|---|---|
| 0 | Daily SMA20 | 1.0644 |
| 1 | Daily SMA50 | 1.0731 |
| 2 | Daily SMA100 | 1.0597 |
| 3 | Daily SMA200 | 1.0331 |
The previous day high was 1.0912 while the previous day low was 1.0759. The daily 38.2% Fib levels comes at 1.0854, expected to provide support. Similarly, the daily 61.8% fib level is at 1.0818, expected to provide support.
Note the levels of interest below:
- Pivot support is noted at 1.0772, 1.0689, 1.0619
- Pivot resistance is noted at 1.0926, 1.0996, 1.1079
| Levels | Levels.1 |
|---|---|
| Previous Daily High | 1.0912 |
| Previous Daily Low | 1.0759 |
| Previous Weekly High | 1.0760 |
| Previous Weekly Low | 1.0516 |
| Previous Monthly High | 1.1033 |
| Previous Monthly Low | 1.0533 |
| Daily Fibonacci 38.2% | 1.0854 |
| Daily Fibonacci 61.8% | 1.0818 |
| Daily Pivot Point S1 | 1.0772 |
| Daily Pivot Point S2 | 1.0689 |
| Daily Pivot Point S3 | 1.0619 |
| Daily Pivot Point R1 | 1.0926 |
| Daily Pivot Point R2 | 1.0996 |
| Daily Pivot Point R3 | 1.1079 |
[/s2If]
Join Our Telegram Group


