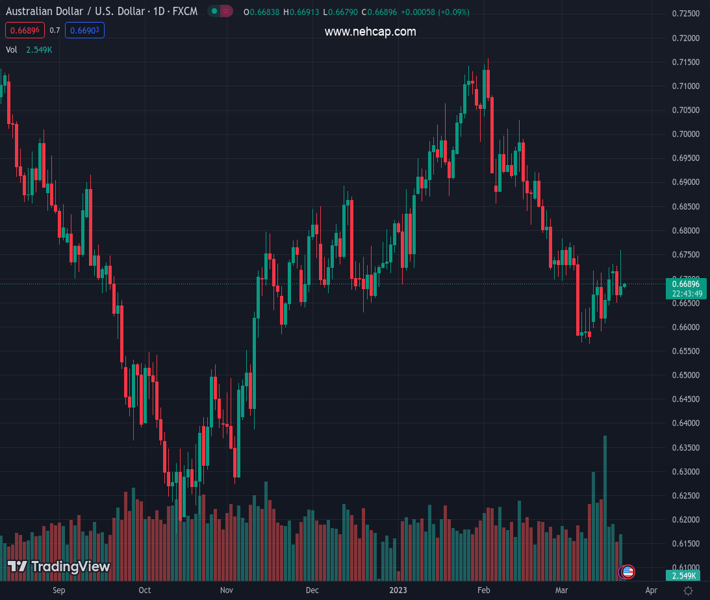
#AUDUSD @ 0.66896 dropped below 0.6700 after Fed’s dovish rate hike. (Pivot Orderbook analysis)
…
This is a premium post.
[s2If !current_user_can(access_s2member_level4)]Please register for PREMIUM VERSION HERE to read full post below containing analysis. In case of any error or you think you are not able to read the full post below, please email us at support#nehcap.com [lwa][/s2If] [s2If current_user_can(access_s2member_level4)]
- AUD/USD dropped below 0.6700 after Fed’s dovish rate hike.
- Fed policymakers remained compromised to tame inflation and mentioned the tight labor market.
- The Fed’s dot plot remained unchanged, with officials expecting to raise rates toward 5.10%.
The pair currently trades last at 0.66896.
The previous day high was 0.6726 while the previous day low was 0.665. The daily 38.2% Fib levels comes at 0.6679, expected to provide support. Similarly, the daily 61.8% fib level is at 0.6697, expected to provide resistance.
The AUD/USD finished Wednesday’s session in the green, gaining 0.26%, though well below the day’s highs at 0.6758. As the Asian Pacific session begins, the AUD/USD trades at 0.6683, slightly below its opening price by 0.01%.
On Wednesday, the US Federal Reserve (Fed) revealed its decision to raise rates by 25 bps and opened the door for an additional quarter of a percentage hike. The banking crisis spurred three weeks ago changed Fed officials’ approach to the March meeting. Given that the US government had to step in after the collapse of two regional banks in the United States (US), it pushed Fed’s Powell 50 bps off the table.
Fed policymakers stressed that inflation remains elevated, and the labor market is tight. Policymakers commented that the balance sheet reduction, known as Quantitative Tightening (QT), would continue as planned. The dot plot was almost unchanged, with most Fed officials expecting the Federal Funds Rate (FFR) to peak at around 5.10%.
At the same time, the US Secretary of Treasure Janet Yellen said that “regulators aren’t looking to provide “blanket” deposit insurance to stabilize the US banking system,” according to Bloomberg. That rattled the US equity markets, which ended with an average of 1.60% losses on its three major indices, blamed on Yellen comments.
All that said, US Treasury bond yields registered losses as investors reassessed a less hawkish Fed. The US 10-year benchmark note rate collapsed 17 bps at 3.451%, undermining the greenback. The US Dollar Index fell to a fresh monthly low of 102.065 but reversed its course and is trading at 102.544, down 0.65%.
On the Australian front, an absent economic docket will leave traders adrift to US Dollar (USD) dynamics and market sentiment.
The AUD/USD remains neutral to downward biased after failing to hold to gains above the 20-day Exponential Moving Average (EMA). Furthermore, the Relative Strength Index (RSI) is bearish, while the Rate of Change (RoC) suggests that sellers are gathering momentum. Hence, the AUD/USD first support would be 0.6600, followed by the YTD low at 0.6564. Once broken, the AUD/USD pair would tumble as low as the November 10 low at 0.6386.
Technical Levels: Supports and Resistances
AUDUSD currently trading at 0.6684 at the time of writing. Pair opened at 0.6669 and is trading with a change of 0.22 % .
| Overview | Overview.1 | |
|---|---|---|
| 0 | Today last price | 0.6684 |
| 1 | Today Daily Change | 0.0015 |
| 2 | Today Daily Change % | 0.2200 |
| 3 | Today daily open | 0.6669 |
The pair remains strongly bearish on the daily time frame. It trades below the 20 SMA @ 0.6693, 50 SMA 0.6862, 100 SMA @ 0.6783 and 200 SMA @ 0.6763.
| Trends | Trends.1 | |
|---|---|---|
| 0 | Daily SMA20 | 0.6693 |
| 1 | Daily SMA50 | 0.6862 |
| 2 | Daily SMA100 | 0.6783 |
| 3 | Daily SMA200 | 0.6763 |
The previous day high was 0.6726 while the previous day low was 0.665. The daily 38.2% Fib levels comes at 0.6679, expected to provide support. Similarly, the daily 61.8% fib level is at 0.6697, expected to provide resistance.
Note the levels of interest below:
- Pivot support is noted at 0.6637, 0.6605, 0.656
- Pivot resistance is noted at 0.6714, 0.6758, 0.679
| Levels | Levels.1 |
|---|---|
| Previous Daily High | 0.6726 |
| Previous Daily Low | 0.6650 |
| Previous Weekly High | 0.6725 |
| Previous Weekly Low | 0.6579 |
| Previous Monthly High | 0.7158 |
| Previous Monthly Low | 0.6698 |
| Daily Fibonacci 38.2% | 0.6679 |
| Daily Fibonacci 61.8% | 0.6697 |
| Daily Pivot Point S1 | 0.6637 |
| Daily Pivot Point S2 | 0.6605 |
| Daily Pivot Point S3 | 0.6560 |
| Daily Pivot Point R1 | 0.6714 |
| Daily Pivot Point R2 | 0.6758 |
| Daily Pivot Point R3 | 0.6790 |
[/s2If]
Join Our Telegram Group


