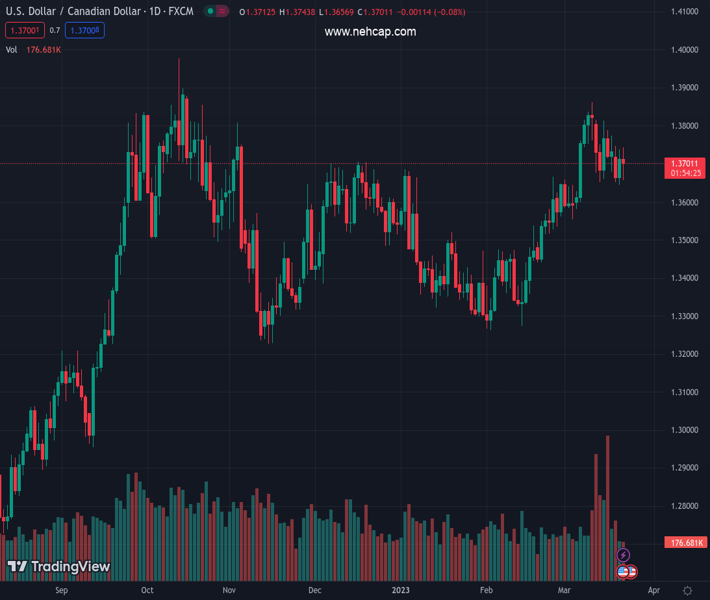
#USDCAD @ 1.36919 collapsed below the 1.3700 figure, trades volatile in the 1.3670-1.3740 range. (Pivot Orderbook analysis)
…
This is a premium post.
[s2If !current_user_can(access_s2member_level4)]Please register for PREMIUM VERSION HERE to read full post below containing analysis. In case of any error or you think you are not able to read the full post below, please email us at support#nehcap.com [lwa][/s2If] [s2If current_user_can(access_s2member_level4)]
- USD/CAD collapsed below the 1.3700 figure, trades volatile in the 1.3670-1.3740 range.
- The Federal Reserve raised rates by 25 bps, as expected by analysts.
- Traders eyed the Federal Reserve Chair Jerome Powell’s press conference.
The pair currently trades last at 1.36919.
The previous day high was 1.3738 while the previous day low was 1.3644. The daily 38.2% Fib levels comes at 1.3702, expected to provide resistance. Similarly, the daily 61.8% fib level is at 1.368, expected to provide support.
The USD/CAD collapsed toward its daily lows at 1.3678 after the US Federal Reserve decided to lift rates by 25 bps. The so-called dot-plot was almost unchanged compared to December’s Summary of Economic Projections (SEP), meaning another 25 bps increase is expected. Therefore, the USD/CAD is trading volatile, around 1.3680-1.3720, ahead of the Fed Chair Powell press conference.
In their decision, Federal Reserve officials decided to raise rates by a quarter percentage point and acknowledged the recent turmoil in the financial markets, which caused the collapse of two regional banks. Though, the US central bank commented that the US banking system is solid and resilient
Aside from this, the monetary policy statement was in line with expectations, with the Fed emphasizing that inflation is too high and that the labor market is too tight. In addition, the balance sheet reduction would continue as planned in May, reiterating that the Committee “is strongly committed to returning inflation to its 2 percent objective.”
Nevertheless, it should be said that the phrase “ongoing increases as appropriate” was removed from March’s monetary policy statement.
The Summary of Economic Projections (SEP) has remained largely the same, with little change. The dot plots, which represent the interest rate projections of Federal Reserve officials, have remained at 5.10%. The expected Real GDP for this period has been revised slightly downward from 0.5% to 0.4%, while the predicted Unemployment Rate has been modified slightly upward from 4.5% to 4.6%. The preferred inflation gauge of the Federal Reserve, the core PCE, is expected to be 3.6%, up from 3.5% in December’s SEP report. Meanwhile, headline inflation is estimated at 3.3%, up from 3.1% in the previous SEP report.
The USD/CAD collapsed toward its daily low at 1.3678, beneath the daily pivot point at 1.3700. A further fall below the S1 daily pivot at 1.3658 would pave the way toward the 1.3600 figure, but firstly the USD/CAD needs to crack the March 21 daily low at 1.3643. Once that happens, 1.3600 is up for grabs.
Technical Levels: Supports and Resistances
USDCAD currently trading at 1.3693 at the time of writing. Pair opened at 1.3712 and is trading with a change of -0.14 % .
| Overview | Overview.1 | |
|---|---|---|
| 0 | Today last price | 1.3693 |
| 1 | Today Daily Change | -0.0019 |
| 2 | Today Daily Change % | -0.1400 |
| 3 | Today daily open | 1.3712 |
The pair remains strongly bullish on the daily timeframe. It trades above its 20 SMA @ 1.3677, 50 SMA 1.3509, 100 SMA @ 1.3511 and 200 SMA @ 1.3348.
| Trends | Trends.1 | |
|---|---|---|
| 0 | Daily SMA20 | 1.3677 |
| 1 | Daily SMA50 | 1.3509 |
| 2 | Daily SMA100 | 1.3511 |
| 3 | Daily SMA200 | 1.3348 |
The previous day high was 1.3738 while the previous day low was 1.3644. The daily 38.2% Fib levels comes at 1.3702, expected to provide resistance. Similarly, the daily 61.8% fib level is at 1.368, expected to provide support.
Note the levels of interest below:
- Pivot support is noted at 1.3659, 1.3605, 1.3566
- Pivot resistance is noted at 1.3752, 1.3791, 1.3845
| Levels | Levels.1 |
|---|---|
| Previous Daily High | 1.3738 |
| Previous Daily Low | 1.3644 |
| Previous Weekly High | 1.3828 |
| Previous Weekly Low | 1.3652 |
| Previous Monthly High | 1.3666 |
| Previous Monthly Low | 1.3262 |
| Daily Fibonacci 38.2% | 1.3702 |
| Daily Fibonacci 61.8% | 1.3680 |
| Daily Pivot Point S1 | 1.3659 |
| Daily Pivot Point S2 | 1.3605 |
| Daily Pivot Point S3 | 1.3566 |
| Daily Pivot Point R1 | 1.3752 |
| Daily Pivot Point R2 | 1.3791 |
| Daily Pivot Point R3 | 1.3845 |
[/s2If]
Join Our Telegram Group


