#XAGUSD @ 22.622 is firm at around the $22.60s area, with traders eyeing Powell and his colleagues. (Pivot Orderbook analysis)
…
This is a premium post.
[s2If !current_user_can(access_s2member_level4)]Please register for PREMIUM VERSION HERE to read full post below containing analysis. In case of any error or you think you are not able to read the full post below, please email us at support#nehcap.com [lwa][/s2If] [s2If current_user_can(access_s2member_level4)]
- XAG/USD is firm at around the $22.60s area, with traders eyeing Powell and his colleagues.
- Silver Price Analysis: Neutral upwards, but Powell’s press conference could rock the boat.
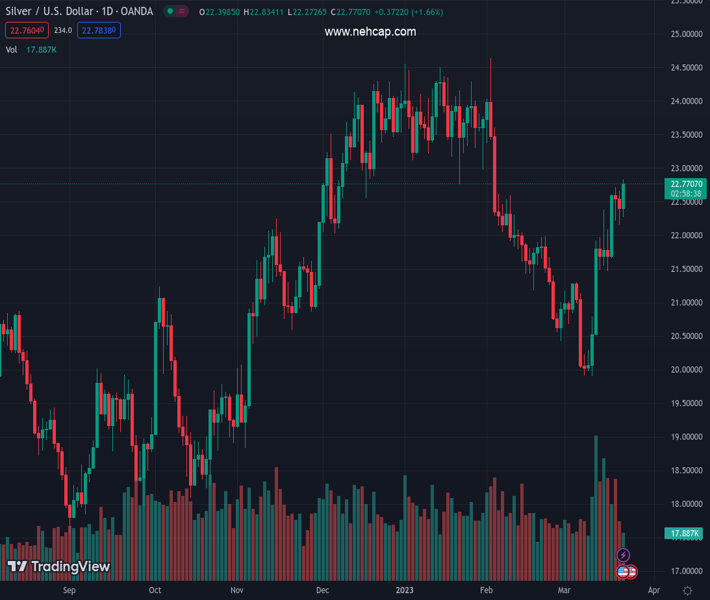
The pair currently trades last at 22.622.
The previous day high was 22.65 while the previous day low was 22.16. The daily 38.2% Fib levels comes at 22.34, expected to provide support. Similarly, the daily 61.8% fib level is at 22.46, expected to provide support.
Silver price tests the higher boundaries of the week, at around $22.70s, as the Fed’s decision looms. Falling US Treasury bond yields and an offered US Dollar (USD) are the main drivers of Silver’s gain of 1.28%.
Silver price remains neutral to upward biased, as shown by the daily chart. Oscillators like the Relative Strength Index (RSI) turned bullish, while the Rate of Change (RoC) displays that buying pressure is waning. Due to mixed signals, caution is warranted.
For a bullish continuation, the XAG/USD needs to reclaim the $23.00 barrier, exposing the February 3 daily high at $23.59, followed by the $24.00 figure, ahead of the YTD high at $24.62. On the other hand, if the XAG/USD drops below the week’s low of $22.14, that would put into play essential support levels.
Given the backdrop, the XAG/USD first support would be the 50-day Exponential Moving Average (EMA) at $21.94. A breach of the latter will expose the 100-day EMA at $21.91, followed by the 200-day EMA at $21.81, and the 20-day EMA at $21.71.
Technical Levels: Supports and Resistances
XAGUSD currently trading at 22.62 at the time of writing. Pair opened at 22.4 and is trading with a change of 0.98 % .
| Overview | Overview.1 | |
|---|---|---|
| 0 | Today last price | 22.62 |
| 1 | Today Daily Change | 0.22 |
| 2 | Today Daily Change % | 0.98 |
| 3 | Today daily open | 22.40 |
The pair remains strongly bullish on the daily timeframe. It trades above its 20 SMA @ 21.23, 50 SMA 22.29, 100 SMA @ 22.38 and 200 SMA @ 20.96.
| Trends | Trends.1 | |
|---|---|---|
| 0 | Daily SMA20 | 21.23 |
| 1 | Daily SMA50 | 22.29 |
| 2 | Daily SMA100 | 22.38 |
| 3 | Daily SMA200 | 20.96 |
The previous day high was 22.65 while the previous day low was 22.16. The daily 38.2% Fib levels comes at 22.34, expected to provide support. Similarly, the daily 61.8% fib level is at 22.46, expected to provide support.
Note the levels of interest below:
- Pivot support is noted at 22.15, 21.91, 21.66
- Pivot resistance is noted at 22.64, 22.89, 23.14
| Levels | Levels.1 |
|---|---|
| Previous Daily High | 22.65 |
| Previous Daily Low | 22.16 |
| Previous Weekly High | 22.61 |
| Previous Weekly Low | 20.54 |
| Previous Monthly High | 24.64 |
| Previous Monthly Low | 20.42 |
| Daily Fibonacci 38.2% | 22.34 |
| Daily Fibonacci 61.8% | 22.46 |
| Daily Pivot Point S1 | 22.15 |
| Daily Pivot Point S2 | 21.91 |
| Daily Pivot Point S3 | 21.66 |
| Daily Pivot Point R1 | 22.64 |
| Daily Pivot Point R2 | 22.89 |
| Daily Pivot Point R3 | 23.14 |
[/s2If]
Join Our Telegram Group


