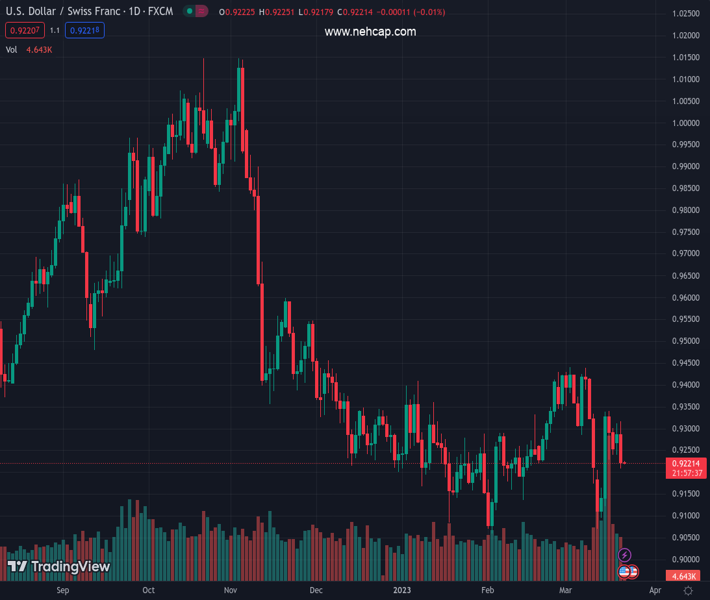
#USDCHF @ 0.92206 turns neutral bearish after dropping below the 50/20 day EMAs. (Pivot Orderbook analysis)
…
This is a premium post.
[s2If !current_user_can(access_s2member_level4)]Please register for PREMIUM VERSION HERE to read full post below containing analysis. In case of any error or you think you are not able to read the full post below, please email us at support#nehcap.com [lwa][/s2If] [s2If current_user_can(access_s2member_level4)]
- USD/CHF turns neutral bearish after dropping below the 50/20 day EMAs.
- USD/CHF Price Analysis: Downward is biased in the near term and might fall beneath 0.9200.
The pair currently trades last at 0.92206.
The previous day high was 0.9312 while the previous day low was 0.924. The daily 38.2% Fib levels comes at 0.9285, expected to provide resistance. Similarly, the daily 61.8% fib level is at 0.9268, expected to provide resistance.
USD/CHF erased Monday’s gains and fell below crucial technical indicators on Tuesday. A risk-on impulse and a soft UD Dollar (USD) were the main reasons for the USD/CHF pair fall. At the time of writing, the USD/CHF is exchanging hands at 0.9222.
From the daily chart perspective, the USD/CHF remains neutral-to-downward biased. After falling below the 50 and 20-day Exponential Moving Averages (EMAs) at 0.9290 and 0.9273, the USD/CHF accelerated its downfall toward the current exchange rates. Consequently, oscillators turned bearish, meaning the USD/CHF could dive toward the March 15 low at 0.9122.
The USD/CHF 4-hour chart portrays the pair as downward biased after breaking below the 0.9239-0.9317 range. Furthermore, the Relative Strength Index (RSI) is bearish, while the Rate of Change (RoC) shows sellers are in charge.
Therefore, the USD/CHF first support would be the 0.9200 figure. A breach of the latter will expose the S1 daily pivot at 0.9182, followed by the S2 pivot at 0.9142 and the 0.9100 mark. In an alternate scenario, the USD/CHF first resistance would be the daily pivot at 0.9250, followed by the R1 pivot point at 0.9288, before testing 0.9300.
Technical Levels: Supports and Resistances
USDCHF currently trading at 0.9223 at the time of writing. Pair opened at 0.9291 and is trading with a change of -0.73 % .
| Overview | Overview.1 | |
|---|---|---|
| 0 | Today last price | 0.9223 |
| 1 | Today Daily Change | -0.0068 |
| 2 | Today Daily Change % | -0.7300 |
| 3 | Today daily open | 0.9291 |
The pair remains strongly bearish on the daily time frame. It trades below the 20 SMA @ 0.9321, 50 SMA 0.926, 100 SMA @ 0.9359 and 200 SMA @ 0.9543.
| Trends | Trends.1 | |
|---|---|---|
| 0 | Daily SMA20 | 0.9321 |
| 1 | Daily SMA50 | 0.9260 |
| 2 | Daily SMA100 | 0.9359 |
| 3 | Daily SMA200 | 0.9543 |
The previous day high was 0.9312 while the previous day low was 0.924. The daily 38.2% Fib levels comes at 0.9285, expected to provide resistance. Similarly, the daily 61.8% fib level is at 0.9268, expected to provide resistance.
Note the levels of interest below:
- Pivot support is noted at 0.925, 0.9209, 0.9178
- Pivot resistance is noted at 0.9322, 0.9353, 0.9393
| Levels | Levels.1 |
|---|---|
| Previous Daily High | 0.9312 |
| Previous Daily Low | 0.9240 |
| Previous Weekly High | 0.9342 |
| Previous Weekly Low | 0.9072 |
| Previous Monthly High | 0.9429 |
| Previous Monthly Low | 0.9059 |
| Daily Fibonacci 38.2% | 0.9285 |
| Daily Fibonacci 61.8% | 0.9268 |
| Daily Pivot Point S1 | 0.9250 |
| Daily Pivot Point S2 | 0.9209 |
| Daily Pivot Point S3 | 0.9178 |
| Daily Pivot Point R1 | 0.9322 |
| Daily Pivot Point R2 | 0.9353 |
| Daily Pivot Point R3 | 0.9393 |
[/s2If]
Join Our Telegram Group
")


