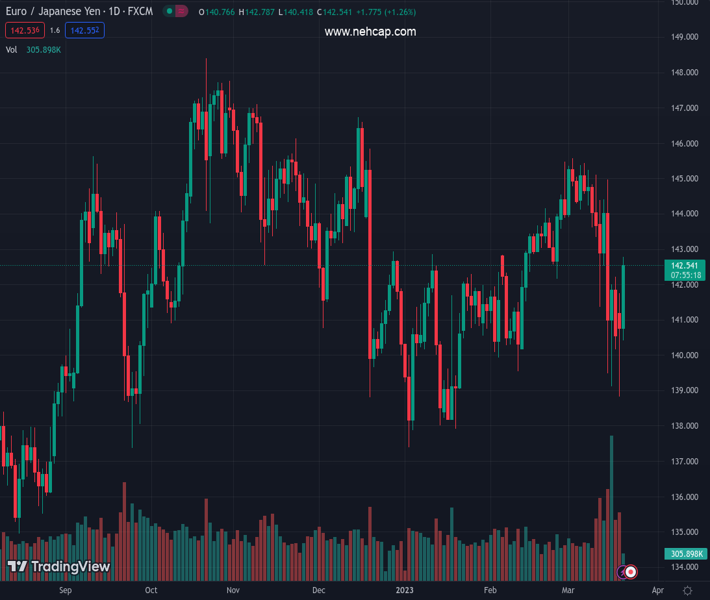
#EURJPY @ 142.528 extends the upside momentum sparked on Monday. (Pivot Orderbook analysis)
…
This is a premium post.
[s2If !current_user_can(access_s2member_level4)]Please register for PREMIUM VERSION HERE to read full post below containing analysis. In case of any error or you think you are not able to read the full post below, please email us at support#nehcap.com [lwa][/s2If] [s2If current_user_can(access_s2member_level4)]
- EUR/JPY extends the upside momentum sparked on Monday.
- Next on the upside comes the YTD peak near 145.60.
The pair currently trades last at 142.528.
The previous day high was 141.75 while the previous day low was 138.83. The daily 38.2% Fib levels comes at 140.63, expected to provide support. Similarly, the daily 61.8% fib level is at 139.95, expected to provide support.
EUR/JPY adds to the uptick seen at the beginning of the week and trades closer to the 143.00 region on Tuesday, an area coincident with the 100-day SMA.
The rebound appears strong and the continuation of this price action should target the 2023 high at 145.56 (March 2) ahead of a potential visit to the December 2022 peak at 146.72 (December 15).
In the meantime, extra losses remain on the cards while the cross trades below the 200-day SMA, today at 141.78.
Technical Levels: Supports and Resistances
EURJPY currently trading at 142.66 at the time of writing. Pair opened at 140.93 and is trading with a change of 1.23 % .
| Overview | Overview.1 | |
|---|---|---|
| 0 | Today last price | 142.66 |
| 1 | Today Daily Change | 237.00 |
| 2 | Today Daily Change % | 1.23 |
| 3 | Today daily open | 140.93 |
The pair is trading below its 20 Daily moving average @ 143.51, above its 50 Daily moving average @ 142.15 , below its 100 Daily moving average @ 142.8 and above its 200 Daily moving average @ 141.81
| Trends | Trends.1 | |
|---|---|---|
| 0 | Daily SMA20 | 143.51 |
| 1 | Daily SMA50 | 142.15 |
| 2 | Daily SMA100 | 142.80 |
| 3 | Daily SMA200 | 141.81 |
The previous day high was 141.75 while the previous day low was 138.83. The daily 38.2% Fib levels comes at 140.63, expected to provide support. Similarly, the daily 61.8% fib level is at 139.95, expected to provide support.
Note the levels of interest below:
- Pivot support is noted at 139.26, 137.58, 136.33
- Pivot resistance is noted at 142.18, 143.43, 145.1
| Levels | Levels.1 |
|---|---|
| Previous Daily High | 141.75 |
| Previous Daily Low | 138.83 |
| Previous Weekly High | 144.96 |
| Previous Weekly Low | 139.13 |
| Previous Monthly High | 145.47 |
| Previous Monthly Low | 139.55 |
| Daily Fibonacci 38.2% | 140.63 |
| Daily Fibonacci 61.8% | 139.95 |
| Daily Pivot Point S1 | 139.26 |
| Daily Pivot Point S2 | 137.58 |
| Daily Pivot Point S3 | 136.33 |
| Daily Pivot Point R1 | 142.18 |
| Daily Pivot Point R2 | 143.43 |
| Daily Pivot Point R3 | 145.10 |
[/s2If]
Join Our Telegram Group
")


