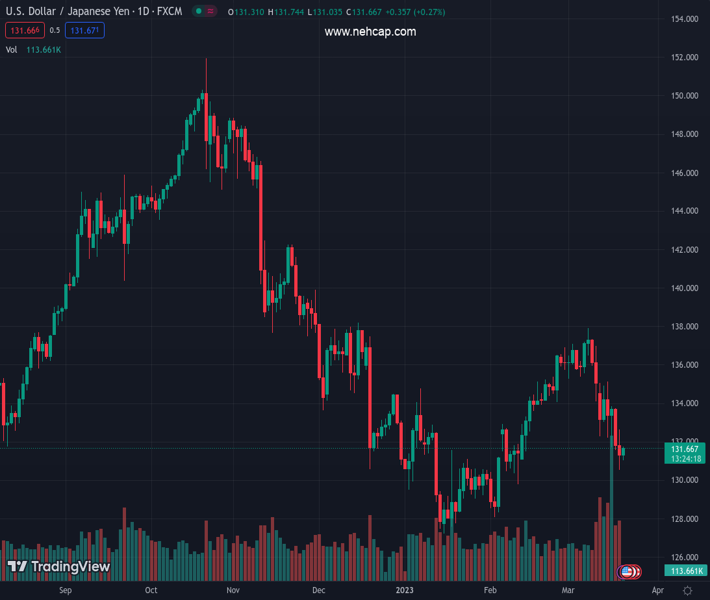
#USDJPY @ 131.688 picks up bids to poke short-term key resistance during the first positive day in three., @nehcap view: Further upside expected (Pivot Orderbook analysis)
…
This is a premium post.
[s2If !current_user_can(access_s2member_level4)]Please register for PREMIUM VERSION HERE to read full post below containing analysis. In case of any error or you think you are not able to read the full post below, please email us at support#nehcap.com [lwa][/s2If] [s2If current_user_can(access_s2member_level4)]
- USD/JPY picks up bids to poke short-term key resistance during the first positive day in three.
- Ascending trend line from mid-January challenges Yen pair bears amid nearly oversold RSI.
- Sluggish MACD, likely trendline breakout on RSI (14) add strength to the bullish bias.
- 200-SMA holds the key to buyers’ entry; sellers have a bumpy road towards the south.
The pair currently trades last at 131.688.
The previous day high was 132.65 while the previous day low was 130.54. The daily 38.2% Fib levels comes at 131.34, expected to provide support. Similarly, the daily 61.8% fib level is at 131.84, expected to provide resistance.
USD/JPY renews its intraday high near 131.70 during the first positive day in three amid early Tuesday in Europe. In doing so, the Yen pair bounces off the lowest levels in five weeks while poking a one-week-old resistance line.
That said, the sluggish MACD signals and the RSI (14) line’s battle with the fortnight-old trend line resistance suggests that the upside momentum is likely to return to the table.
Adding strength to the bullish bias could be the USD/JPY pair’s recovery from an ascending support line from January 16, close to 130.60 by the press time.
As a result, the USD/JPY pair is likely to cross the immediate trend line hurdle surrounding 131.70, which in turn could allow the buyers to aim for another upside hurdle, namely a downward-sloping resistance line from March 08, close to 133.10 at the latest.
It should, however, be noted that the USD/JPY bulls should remain cautious unless the quote remains below the 200-SMA level surrounding 134.10.
Alternatively, a clear downside break of the stated multi-day-old support line, around 130.60, isn’t an open invitation to the USD/JPY bears as multiple lows marked during February 10 and early January, respectively near 129.80 and 128.00, as well as the Year-To-Date (YTD) bottom near 127.20 could challenge the Yen pair sellers afterward.
Trend: Further upside expected
Technical Levels: Supports and Resistances
USDJPY currently trading at 131.71 at the time of writing. Pair opened at 131.33 and is trading with a change of 0.29% % .
| Overview | Overview.1 | |
|---|---|---|
| 0 | Today last price | 131.71 |
| 1 | Today Daily Change | 0.38 |
| 2 | Today Daily Change % | 0.29% |
| 3 | Today daily open | 131.33 |
The pair remains strongly bearish on the daily time frame. It trades below the 20 SMA @ 135.06, 50 SMA 132.53, 100 SMA @ 135.1 and 200 SMA @ 137.46.
| Trends | Trends.1 | |
|---|---|---|
| 0 | Daily SMA20 | 135.06 |
| 1 | Daily SMA50 | 132.53 |
| 2 | Daily SMA100 | 135.10 |
| 3 | Daily SMA200 | 137.46 |
The previous day high was 132.65 while the previous day low was 130.54. The daily 38.2% Fib levels comes at 131.34, expected to provide support. Similarly, the daily 61.8% fib level is at 131.84, expected to provide resistance.
Note the levels of interest below:
- Pivot support is noted at 130.36, 129.4, 128.25
- Pivot resistance is noted at 132.47, 133.61, 134.58
| Levels | Levels.1 |
|---|---|
| Previous Daily High | 132.65 |
| Previous Daily Low | 130.54 |
| Previous Weekly High | 135.12 |
| Previous Weekly Low | 131.56 |
| Previous Monthly High | 136.92 |
| Previous Monthly Low | 128.08 |
| Daily Fibonacci 38.2% | 131.34 |
| Daily Fibonacci 61.8% | 131.84 |
| Daily Pivot Point S1 | 130.36 |
| Daily Pivot Point S2 | 129.40 |
| Daily Pivot Point S3 | 128.25 |
| Daily Pivot Point R1 | 132.47 |
| Daily Pivot Point R2 | 133.61 |
| Daily Pivot Point R3 | 134.58 |
[/s2If]
Join Our Telegram Group
")


