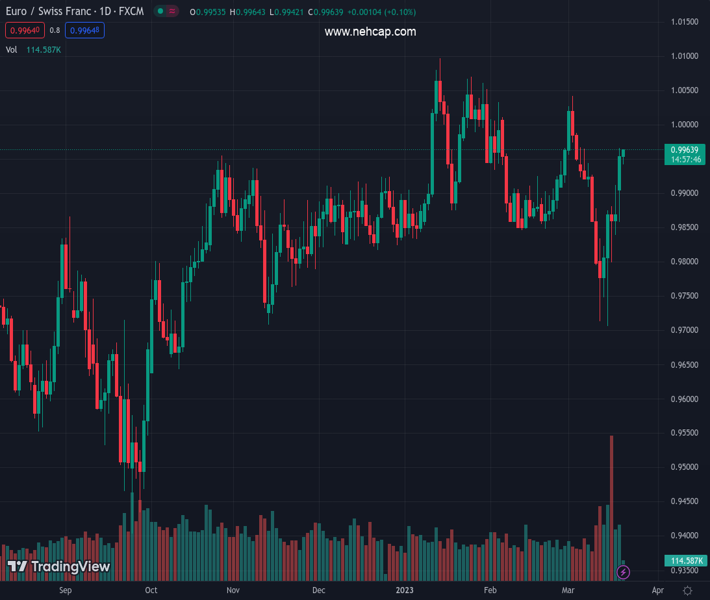
#EURCHF @ 0.99631 is aiming to recapture the 1.0000 resistance as hawkish ECB bets soar. (Pivot Orderbook analysis)
…
This is a premium post.
[s2If !current_user_can(access_s2member_level4)]Please register for PREMIUM VERSION HERE to read full post below containing analysis. In case of any error or you think you are not able to read the full post below, please email us at support#nehcap.com [lwa][/s2If] [s2If current_user_can(access_s2member_level4)]
- EUR/CHF is aiming to recapture the 1.0000 resistance as hawkish ECB bets soar.
- ECB Lagarde cited that inflation is projected to remain too high for too long.
- The demise of Credit Suisse has continued to weigh on the Swiss Franc.
The pair currently trades last at 0.99631.
The previous day high was 0.9966 while the previous day low was 0.9859. The daily 38.2% Fib levels comes at 0.9925, expected to provide support. Similarly, the daily 61.8% fib level is at 0.99, expected to provide support.
The EUR/CHF pair is attempting to come out of the woods for an upside move above the immediate resistance of 0.9966 in the Asian session. The cross has remained in action after the demise of Credit Suisse, the second-largest bank in Switzerland. Although UBS has announced the acquisition of the former, the street expects that the fears of further banking turmoil would stay for a while.
The Euro has gained traction as European Central Bank (ECB) President Christine Lagarde has revised its guidance for Eurozone inflation on the upside. ECB Lagarde cited that inflation is projected to remain too high for too long, as reported by Reuters. She further added that wage pressures have strengthened on the back of robust labor markets and added that employees are aiming to recoup some of the purchasing power. This has bolstered hopes of the continuation of bigger rate hikes from the ECB.
EUR/CHF pair has extended its upside journey to near the prior inventory adjustment area whose breakdown led to a massive sell-off. The inventory adjustment area in a range of 0.9923-0.9967 serves as a territory where the asset spent the majority of time in its prior move and also covers significant volume.
The 20-period Exponential Moving Average (EMA) at 0.9940 is sloping north and will continue to provide support to the Euro bulls.
Adding to that, the Relative Strength Index (RSI) (14) is oscillating in the bullish range of 60.00-80.00, which indicates that bullish momentum is already active.
For further upside, a decisive break above March 20 high at 0.9966 will drive the cross toward the psychological resistance at 1.0000 followed by March 02 high at 1.0042.
On the flip side, a downside break below March 16 low at 0.9800 would drag the cross toward March 14 low at 0.9748. A slippage below the latter would expose the cross to March 15 low at 0.9706.
Technical Levels: Supports and Resistances
EURCHF currently trading at 0.9962 at the time of writing. Pair opened at 0.9961 and is trading with a change of 0.01 % .
| Overview | Overview.1 | |
|---|---|---|
| 0 | Today last price | 0.9962 |
| 1 | Today Daily Change | 0.0001 |
| 2 | Today Daily Change % | 0.0100 |
| 3 | Today daily open | 0.9961 |
The pair remains strongly bullish on the daily timeframe. It trades above its 20 SMA @ 0.9904, 50 SMA 0.9934, 100 SMA @ 0.9895 and 200 SMA @ 0.9848.
| Trends | Trends.1 | |
|---|---|---|
| 0 | Daily SMA20 | 0.9904 |
| 1 | Daily SMA50 | 0.9934 |
| 2 | Daily SMA100 | 0.9895 |
| 3 | Daily SMA200 | 0.9848 |
The previous day high was 0.9966 while the previous day low was 0.9859. The daily 38.2% Fib levels comes at 0.9925, expected to provide support. Similarly, the daily 61.8% fib level is at 0.99, expected to provide support.
Note the levels of interest below:
- Pivot support is noted at 0.9891, 0.9821, 0.9784
- Pivot resistance is noted at 0.9998, 1.0036, 1.0105
| Levels | Levels.1 |
|---|---|
| Previous Daily High | 0.9966 |
| Previous Daily Low | 0.9859 |
| Previous Weekly High | 0.9913 |
| Previous Weekly Low | 0.9706 |
| Previous Monthly High | 1.0033 |
| Previous Monthly Low | 0.9847 |
| Daily Fibonacci 38.2% | 0.9925 |
| Daily Fibonacci 61.8% | 0.9900 |
| Daily Pivot Point S1 | 0.9891 |
| Daily Pivot Point S2 | 0.9821 |
| Daily Pivot Point S3 | 0.9784 |
| Daily Pivot Point R1 | 0.9998 |
| Daily Pivot Point R2 | 1.0036 |
| Daily Pivot Point R3 | 1.0105 |
[/s2If]
Join Our Telegram Group
")


