#NZDUSD @ 0.62095 extends the previous day’s pullback from one-month high inside rising wedge bearish chart pattern., @nehcap view: Further downside expected (Pivot Orderbook analysis)
…
This is a premium post.
[s2If !current_user_can(access_s2member_level4)]Please register for PREMIUM VERSION HERE to read full post below containing analysis. In case of any error or you think you are not able to read the full post below, please email us at support#nehcap.com [lwa][/s2If] [s2If current_user_can(access_s2member_level4)]
- NZD/USD extends the previous day’s pullback from one-month high inside rising wedge bearish chart pattern.
- Convergence of 100-SMA, wedge’s support and 23.6% Fibonacci retracement highlights 0.6190 level.
- Bearish MACD signals, failure to cross descending resistance from late February keep Kiwi pair sellers hopeful.
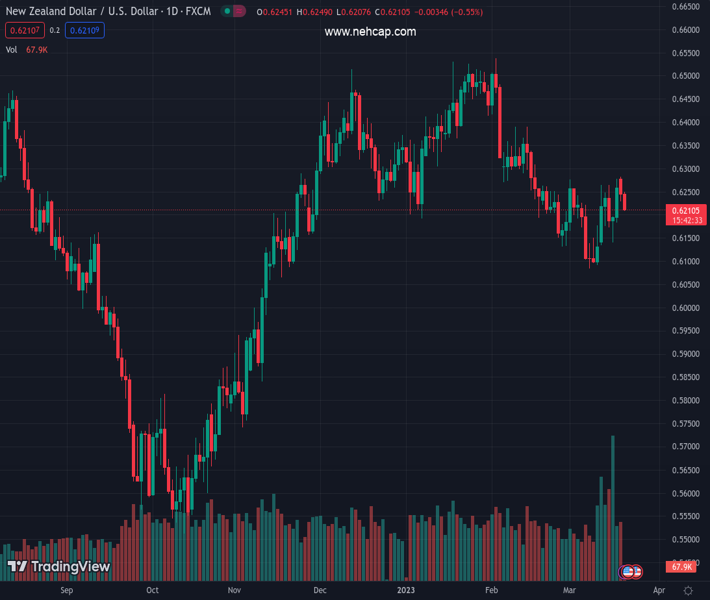
The pair currently trades last at 0.62095.
The previous day high was 0.6289 while the previous day low was 0.6228. The daily 38.2% Fib levels comes at 0.6251, expected to provide resistance. Similarly, the daily 61.8% fib level is at 0.6266, expected to provide resistance.
NZD/USD sellers attack a 0.6200 round figure during a two-day downbeat after refreshing the monthly top. Even so, the Kiwi pair stays within a fortnight-old rising wedge bearish chart pattern during early Tuesday in Europe.
Not only the rising wedge but the bearish MACD signals and repeated failures to cross an upward-sloping resistance line from February 20 also keep NZD/USD sellers hopeful.
However, the 100-SMA joins the stated wedge’s lower line and 23.6% Fibonacci retracement of the pair’s February-March fall to highlight 0.6190 as a tough nut to crack for the bears.
In a case where the quote successfully breaks the 0.6190 support confluence, the odds of witnessing a slump toward the theoretical target surrounding the 0.6000 psychological magnet can’t be ruled out.
During the anticipated fall, the 0.6100 threshold and the monthly low of 0.6084 can act as buffers.
Meanwhile, recovery moves may initially aim for the 38.2% Fibonacci retracement level of 0.6257 before challenging the aforementioned monthly resistance line, near 0.6275 by the press time.
Even so, the NZD/USD pair sellers remain hopeful unless the quote stays below the aforementioned wedge’s top line, close to 0.6300 as we write.
Overall, NZD/USD remains on the bear’s radar but the pair’s further downside hinges on a 0.6190 breakdown.
Trend: Further downside expected
Technical Levels: Supports and Resistances
NZDUSD currently trading at 0.6212 at the time of writing. Pair opened at 0.6246 and is trading with a change of -0.54 % .
| Overview | Overview.1 | |
|---|---|---|
| 0 | Today last price | 0.6212 |
| 1 | Today Daily Change | -0.0034 |
| 2 | Today Daily Change % | -0.5400 |
| 3 | Today daily open | 0.6246 |
The pair is trading above its 20 Daily moving average @ 0.6194, below its 50 Daily moving average @ 0.631 , below its 100 Daily moving average @ 0.6267 and above its 200 Daily moving average @ 0.6162
| Trends | Trends.1 | |
|---|---|---|
| 0 | Daily SMA20 | 0.6194 |
| 1 | Daily SMA50 | 0.6310 |
| 2 | Daily SMA100 | 0.6267 |
| 3 | Daily SMA200 | 0.6162 |
The previous day high was 0.6289 while the previous day low was 0.6228. The daily 38.2% Fib levels comes at 0.6251, expected to provide resistance. Similarly, the daily 61.8% fib level is at 0.6266, expected to provide resistance.
Note the levels of interest below:
- Pivot support is noted at 0.622, 0.6193, 0.6159
- Pivot resistance is noted at 0.6281, 0.6316, 0.6342
| Levels | Levels.1 |
|---|---|
| Previous Daily High | 0.6289 |
| Previous Daily Low | 0.6228 |
| Previous Weekly High | 0.6278 |
| Previous Weekly Low | 0.6131 |
| Previous Monthly High | 0.6538 |
| Previous Monthly Low | 0.6131 |
| Daily Fibonacci 38.2% | 0.6251 |
| Daily Fibonacci 61.8% | 0.6266 |
| Daily Pivot Point S1 | 0.6220 |
| Daily Pivot Point S2 | 0.6193 |
| Daily Pivot Point S3 | 0.6159 |
| Daily Pivot Point R1 | 0.6281 |
| Daily Pivot Point R2 | 0.6316 |
| Daily Pivot Point R3 | 0.6342 |
[/s2If]
Join Our Telegram Group
")


