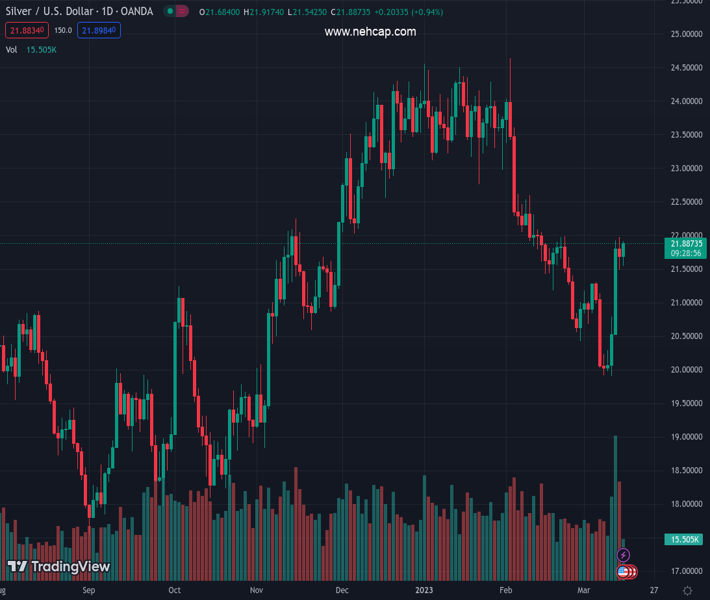
#XAGUSD @ 21.849 climbs modestly, last trading at $21.81 (Pivot Orderbook analysis)
…
This is a premium post.
[s2If !current_user_can(access_s2member_level4)]Please register for PREMIUM VERSION HERE to read full post below containing analysis. In case of any error or you think you are not able to read the full post below, please email us at support#nehcap.com [lwa][/s2If] [s2If current_user_can(access_s2member_level4)]
The pair currently trades last at 21.849.
The previous day high was 21.98 while the previous day low was 21.48. The daily 38.2% Fib levels comes at 21.67, expected to provide support. Similarly, the daily 61.8% fib level is at 21.78, expected to provide support.
XAG/USD (Silver) sees a modestly bullish intraday movement on Wednesday, with the last recorded price at $21.81. The commodity starts the session at $21.69, the previous close, and fluctuates between the lowest intraday price of $21.55 and the highest intraday price of $21.92. The overall intraday price change stands at +0.55% at press time.
On Wednesday, USD/JPY traders should closely monitor the US February Retail Sales (12:30 GMT) and the US Producer Price Index (excluding food and energy at 12:30 GMT) data.
XAG/USD pair has been trading above its daily 20-SMA ($21.11) but below its 50-SMA ($22.38), indicating mixed signals in short to medium term. Silver price has broken above the $21.30 highs, the last lower high of the previous downtrend, which is a bullish signal and increases the probabilities the trend may be reversing.
Daily RSI(14) of 55.369 indicates a slightly bullish momentum as the pair trades above the 50 mark. However, the market may encounter some resistance, as the daily resistance levels are $21.96, $22.22, and $22.46.
The daily pivot point for the XAG/USD pair is $21.72, close to the last intraday price at press time. The daily support levels are $21.46, $21.22, and $20.96. If the pair manages to break above the pivot point, it may test the resistance levels, while a break below the pivot point could trigger a test of the support levels.
Technical Levels: Supports and Resistances
XAGUSD currently trading at 21.77 at the time of writing. Pair opened at 21.7 and is trading with a change of 0.32 % .
| Overview | Overview.1 | |
|---|---|---|
| 0 | Today last price | 21.77 |
| 1 | Today Daily Change | 0.07 |
| 2 | Today Daily Change % | 0.32 |
| 3 | Today daily open | 21.70 |
The pair is trading above its 20 Daily moving average @ 21.11, below its 50 Daily moving average @ 22.43 , below its 100 Daily moving average @ 22.25 and above its 200 Daily moving average @ 20.94
| Trends | Trends.1 | |
|---|---|---|
| 0 | Daily SMA20 | 21.11 |
| 1 | Daily SMA50 | 22.43 |
| 2 | Daily SMA100 | 22.25 |
| 3 | Daily SMA200 | 20.94 |
The previous day high was 21.98 while the previous day low was 21.48. The daily 38.2% Fib levels comes at 21.67, expected to provide support. Similarly, the daily 61.8% fib level is at 21.78, expected to provide support.
Note the levels of interest below:
- Pivot support is noted at 21.46, 21.22, 20.96
- Pivot resistance is noted at 21.96, 22.22, 22.46
| Levels | Levels.1 |
|---|---|
| Previous Daily High | 21.98 |
| Previous Daily Low | 21.48 |
| Previous Weekly High | 21.31 |
| Previous Weekly Low | 19.90 |
| Previous Monthly High | 24.64 |
| Previous Monthly Low | 20.42 |
| Daily Fibonacci 38.2% | 21.67 |
| Daily Fibonacci 61.8% | 21.78 |
| Daily Pivot Point S1 | 21.46 |
| Daily Pivot Point S2 | 21.22 |
| Daily Pivot Point S3 | 20.96 |
| Daily Pivot Point R1 | 21.96 |
| Daily Pivot Point R2 | 22.22 |
| Daily Pivot Point R3 | 22.46 |
[/s2If]
Join Our Telegram Group
")


