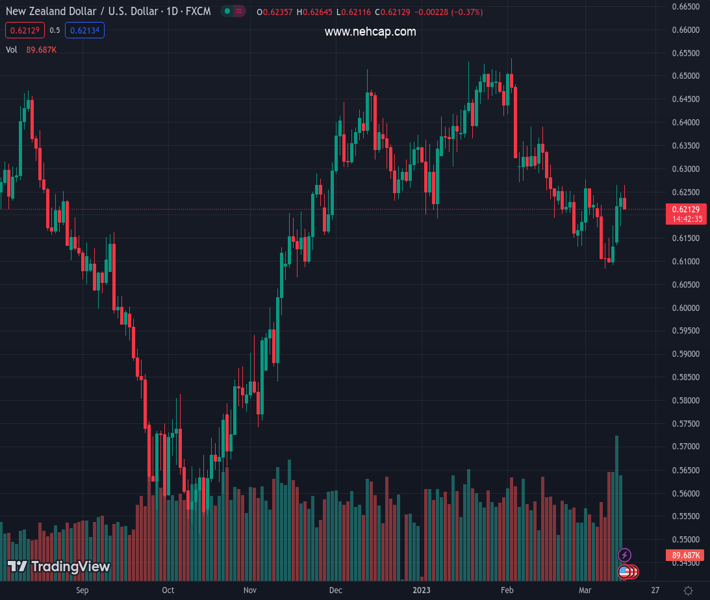
#NZDUSD @ 0.62130 has sensed heat while attempting to surpass the 0.6250 resistance despite the risk-on impulse. (Pivot Orderbook analysis)
…
This is a premium post.
[s2If !current_user_can(access_s2member_level4)]Please register for PREMIUM VERSION HERE to read full post below containing analysis. In case of any error or you think you are not able to read the full post below, please email us at support#nehcap.com [lwa][/s2If] [s2If current_user_can(access_s2member_level4)]
- NZD/USD has sensed heat while attempting to surpass the 0.6250 resistance despite the risk-on impulse.
- Declining US CPI, higher jobless rate, and the SVB collapse might force the Federal Reserve (Fed) to remain less hawkish on interest rates.
- A weak NZ growth rate might delight Reserve Bank of New Zealand policymakers as inflationary pressures could come down ahead.
- NZD/USD is expected to deliver some downside as it has surrendered the 20-EMA support.
The pair currently trades last at 0.62130.
The previous day high was 0.6248 while the previous day low was 0.6198. The daily 38.2% Fib levels comes at 0.6229, expected to provide resistance. Similarly, the daily 61.8% fib level is at 0.6217, expected to provide resistance.
NZD/USD is facing hurdles in stretching its recovery above the immediate resistance of 0.6250 in the early European session. The Kiwi asset has sensed barricades near 0.6250 as the recovery attempt by the US Dollar Index (DXY) has trimmed the pace of the upside move.
After printing a fresh monthly low at 103.44, the USD Index has attracted bids and has scaled above 103.60. The downside bias for the USD Index looks solid as the Federal Reserve (Fed) is likely to avoid the option of bigger rate announcement as the United States inflation has softened, the Unemployment Rate has increased, and the US economy’s confidence has been hit hard after the catastrophic collapse of Silicon Valley Bank (SVB).
S&P500 futures have turned positive after reporting marginal losses in early Asia. The 500-US stocks basket printed superlative gains on Tuesday as investors cheered the declining inflation spell, which resulted in easing odds of 50 basis points (bps) rate hike from the Federal Reserve. Meanwhile, the return offered on 10-year US Treasury yields is still solid above 3.67% as the street has mixed views on US Consumer Price Index (CPI).
Tuesday’s US CPI release unleashed bulls linked to risk-sensitive assets as a decline in the headline inflation to 6.0%, as anticipated, bolstered the chances of a smaller rate hike from Federal Reserve chair Jerome Powell for his next monetary policy meeting, scheduled for next week.
A scrutiny of the US inflation report dictated that prices of used cars continued to decline, however, house rent climbed higher, weighing immense pressure on households.
Analysts at Wells Fargo believe “Core CPI inflation remained entrenched at uncomfortably high levels. With core CPI up 0.5% in February, it is rising at an annualized rate of more than 5% whether measured on a 1-month, 3-month, or 12-month basis.” However, the agency cited that the 25 bps rate hike is still a distinct possibility if financial stresses ease.”
After US inflation softening and mixed Employment data, investors are shifting their focus toward the release of the Retail Sales and Producer Price Index (PPI) data. Economists from NBF are of the view that “Car dealers likely contributed negatively to the headline number, as auto sales fell during the month. Gasoline station receipts, meanwhile, could have stayed more or less unchanged judging by the stagnation in pump prices. All told, headline sales could have contracted 0.7%, erasing only a fraction of January’s gain. Spending on items other than vehicles could have fared a little better, retreating just 0.5%.”
A deceleration in consumer resilience would further add to the expectations of a smaller rate hike by the Federal Reserve.
Furthermore, the release of the US PPI data will be keenly watched. Consensus says an expansion in the monthly US PPI by 0.3%, lower than the former release of 0.7%. While the annual figure would soften to 5.4% from the prior release of 6%. A decline in the PPI figures would indicate that producers are struggling to expand the prices of goods and services at factory gates due to a decline in the overall demand. Eventually, it would trim the demand for labor and the overall inflation ahead.
Investors are keenly awaiting the release of the New Zealand Gross Domestic Product (GDP) (Q4) for fresh impetus. As per the estimates, the NZ economy has contracted by 0.2% vs. a growth of 2.0% witnessed in the third quarter. The annual GDP (Q4) has expanded by 3.3%, lower than the prior expansion of 6.4%. A decline in the growth rate indicates subdued demand from households, which will relieve the stress of Reserve Bank of New Zealand (RBNZ) policymakers, which are making efforts in decelerating inflation expectations.
Meanwhile, Bloomberg reported, “New Zealand’s credit grades with S&P Global Ratings could come under pressure if the nation’s current account deficit remains too big.”. Data released on Wednesday in early Asia showed the current account deficit blew out to 8.9% of Gross Domestic Product (GDP) in 2022 as the nation imported more goods and services than it exported.
NZD/USD has faced immense heat near the supply zone placed in a range of 0.6264-0.6278 on an hourly scale. Anticipation for further downside has solidified as the Kiwi asset has surrendered the support of the 20-period Exponential Moving Average (EMA), which is currently near 0.6227.
Failure of the Relative Strength Index (RSI) (14) in recapturing the bullish range of 60.00-80.00, indicates a loss in the upside momentum.
Technical Levels: Supports and Resistances
NZDUSD currently trading at 0.6217 at the time of writing. Pair opened at 0.6237 and is trading with a change of -0.32 % .
| Overview | Overview.1 | |
|---|---|---|
| 0 | Today last price | 0.6217 |
| 1 | Today Daily Change | -0.0020 |
| 2 | Today Daily Change % | -0.3200 |
| 3 | Today daily open | 0.6237 |
The pair is trading above its 20 Daily moving average @ 0.6201, below its 50 Daily moving average @ 0.6317 , below its 100 Daily moving average @ 0.625 and above its 200 Daily moving average @ 0.6165
| Trends | Trends.1 | |
|---|---|---|
| 0 | Daily SMA20 | 0.6201 |
| 1 | Daily SMA50 | 0.6317 |
| 2 | Daily SMA100 | 0.6250 |
| 3 | Daily SMA200 | 0.6165 |
The previous day high was 0.6248 while the previous day low was 0.6198. The daily 38.2% Fib levels comes at 0.6229, expected to provide resistance. Similarly, the daily 61.8% fib level is at 0.6217, expected to provide resistance.
Note the levels of interest below:
- Pivot support is noted at 0.6207, 0.6177, 0.6157
- Pivot resistance is noted at 0.6257, 0.6278, 0.6308
| Levels | Levels.1 |
|---|---|
| Previous Daily High | 0.6248 |
| Previous Daily Low | 0.6198 |
| Previous Weekly High | 0.6226 |
| Previous Weekly Low | 0.6084 |
| Previous Monthly High | 0.6538 |
| Previous Monthly Low | 0.6131 |
| Daily Fibonacci 38.2% | 0.6229 |
| Daily Fibonacci 61.8% | 0.6217 |
| Daily Pivot Point S1 | 0.6207 |
| Daily Pivot Point S2 | 0.6177 |
| Daily Pivot Point S3 | 0.6157 |
| Daily Pivot Point R1 | 0.6257 |
| Daily Pivot Point R2 | 0.6278 |
| Daily Pivot Point R3 | 0.6308 |
[/s2If]
Join Our Telegram Group
")


