#XAGUSD @ 21.712 Silver price prints minor gains inside immediate trading range established from Monday., @nehcap view: Limited downside expected (Pivot Orderbook analysis)
…
This is a premium post.
[s2If !current_user_can(access_s2member_level4)]Please register for PREMIUM VERSION HERE to read full post below containing analysis. In case of any error or you think you are not able to read the full post below, please email us at support#nehcap.com [lwa][/s2If] [s2If current_user_can(access_s2member_level4)]
- Silver price prints minor gains inside immediate trading range established from Monday.
- 200-EMA, three-week-old horizontal resistance restricts short-term XAG/USD moves.
- RSI’s retreat from overbought territory, looming bear cross on MACD lure the Silver sellers.
- Road towards the south appears bumpier; bulls need validation from $22.60.
The pair currently trades last at 21.712.
The previous day high was 21.98 while the previous day low was 21.48. The daily 38.2% Fib levels comes at 21.67, expected to provide support. Similarly, the daily 61.8% fib level is at 21.78, expected to provide resistance.
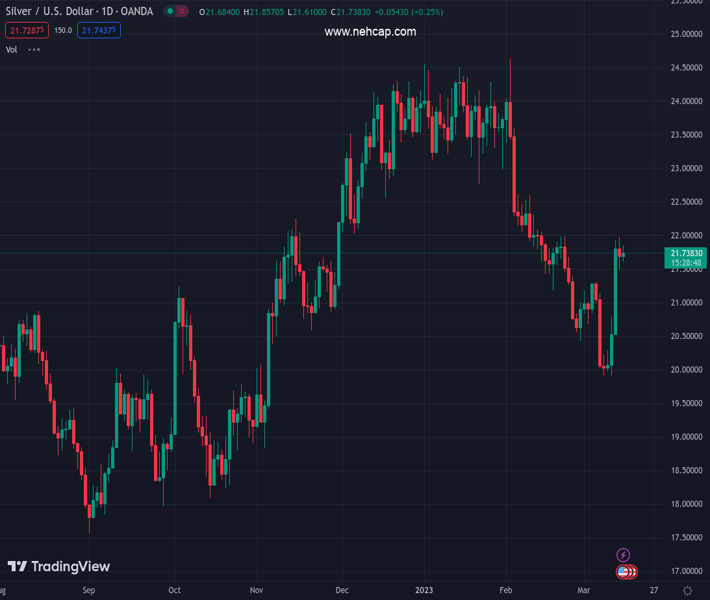
Silver price (XAG/USD) eases to $21.70 as it pares the intraday gains heading into Wednesday’s European session. In doing so, the bright metal defends a three-day-old trading range even as the bearish signals have recently gained momentum.
That said, the 200-bar Exponential Moving Average (EMA) puts a floor under the XAG/USD price of around $21.60 while a three-week-long horizontal line, around $22.00, restricts the metal’s short-term upside since the last Monday.
It should, however, be noted that the RSI line, placed at 14, eases from the overbought territory and joins the impending bear cross on the MACD signals to tease the Silver sellers.
A horizontal support comprising multiple levels marked since February 17, close to $21.20, could lure the XAG/USD bears on the break of $22.00.
In a case where the bullion remains bearish past $21.20, a fortnight-long broad support zone between $20.30 and $20.40, could challenge the sellers.
Alternatively, a clear upside break of the $22.00 hurdle will need validation from multiple tops marked during early February around $22.60 to convince the Silver buyers.
Overall, the Silver price remains sidelined but the bears are lurking behind the immediate support.
Trend: Limited downside expected
Technical Levels: Supports and Resistances
XAGUSD currently trading at 21.73 at the time of writing. Pair opened at 21.7 and is trading with a change of 0.14 % .
| Overview | Overview.1 | |
|---|---|---|
| 0 | Today last price | 21.73 |
| 1 | Today Daily Change | 0.03 |
| 2 | Today Daily Change % | 0.14 |
| 3 | Today daily open | 21.70 |
The pair is trading above its 20 Daily moving average @ 21.11, below its 50 Daily moving average @ 22.43 , below its 100 Daily moving average @ 22.25 and above its 200 Daily moving average @ 20.94
| Trends | Trends.1 | |
|---|---|---|
| 0 | Daily SMA20 | 21.11 |
| 1 | Daily SMA50 | 22.43 |
| 2 | Daily SMA100 | 22.25 |
| 3 | Daily SMA200 | 20.94 |
The previous day high was 21.98 while the previous day low was 21.48. The daily 38.2% Fib levels comes at 21.67, expected to provide support. Similarly, the daily 61.8% fib level is at 21.78, expected to provide resistance.
Note the levels of interest below:
- Pivot support is noted at 21.46, 21.22, 20.96
- Pivot resistance is noted at 21.96, 22.22, 22.46
| Levels | Levels.1 |
|---|---|
| Previous Daily High | 21.98 |
| Previous Daily Low | 21.48 |
| Previous Weekly High | 21.31 |
| Previous Weekly Low | 19.90 |
| Previous Monthly High | 24.64 |
| Previous Monthly Low | 20.42 |
| Daily Fibonacci 38.2% | 21.67 |
| Daily Fibonacci 61.8% | 21.78 |
| Daily Pivot Point S1 | 21.46 |
| Daily Pivot Point S2 | 21.22 |
| Daily Pivot Point S3 | 20.96 |
| Daily Pivot Point R1 | 21.96 |
| Daily Pivot Point R2 | 22.22 |
| Daily Pivot Point R3 | 22.46 |
[/s2If]
Join Our Telegram Group
")


