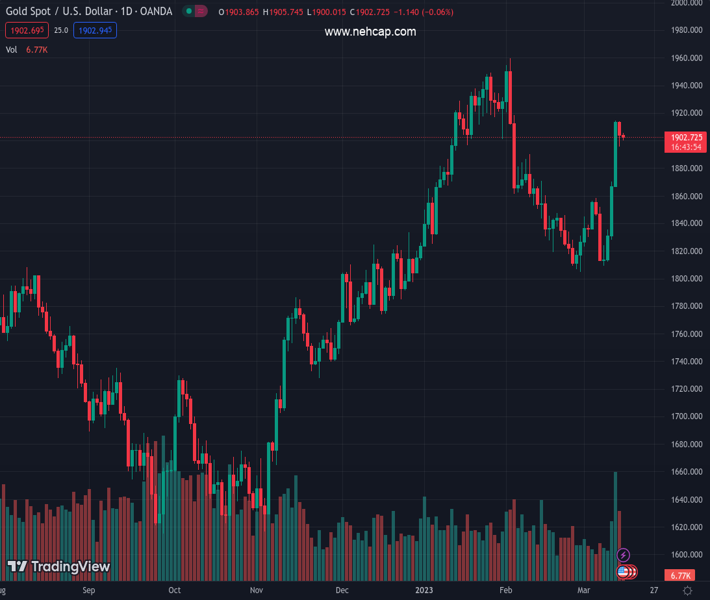
Gold price eyes March high at the $1,915 mark amid falling yields. (Pivot Orderbook analysis)
…
This is a premium post.
[s2If !current_user_can(access_s2member_level4)]Please register for PREMIUM VERSION HERE to read full post below containing analysis. In case of any error or you think you are not able to read the full post below, please email us at support#nehcap.com [lwa][/s2If] [s2If current_user_can(access_s2member_level4)]
- Gold price eyes March high at the $1,915 mark amid falling yields.
- US CPI release looks pessimistic for the US Dollar.
- US Retail Sales and PPI data are the highlights for the day.
The pair currently trades last at 1902.98.
The previous day high was 1914.32 while the previous day low was 1895.43. The daily 38.2% Fib levels comes at 1902.65, expected to provide support. Similarly, the daily 61.8% fib level is at 1907.1, expected to provide resistance.
Gold price is consolidating above the $1,900 mark amid a softer US Dollar and positive risk sentiment. The US Consumer Price Index (CPI) released on Tuesday relaxed investors as the data came in line with expectations.
The US CPI headlines MoM reading came in at 0.4% from the prior 0.5%, and the YoY reading came in at 6.0% from the prior 6.4%. The core component MoM came in at 0.5%, slightly higher than the prior 0.4%, and YoY variant came in at 5.5% from 5.6%. The service, excluding the shelter component, came in softer than expected. The aforementioned data has been perceived positively by investors and as a result, a surge has been seen in US equity complexes on Tuesday.
Investors have become increasingly cautious and concerned about Tuesday’s US CPI release due to the fallout from Silicon Valley Bank (SVB), which has highlighted the underlying damage within the US banking and financial system. As a result, the Federal Reserve (Fed) may need to halt its rate-hiking cycle sooner than expected to address the situation. However, a stronger US CPI release could pose a challenge to this plan.
Nevertheless, a relatively calm US CPI release has made Fed’s job a little easy, as the most concerning part of the inflationary matrix, ex-shelter, had signaled some easing.
Regarding current market dynamics, the March FOMC meeting could be a one and done deal for the rate hiking cycle, and the market could speculate on the possibility for a rate cut at the end of 2023. However, more clarity is needed on that front.
Moving on to the economic calendar, US Retails Sales data and Producer Price Index (PPI) is on the docket for Wednesday.
It will be important to watch the US Retail Sales data if it signals any muted retail activity prior to the FOMC meeting on March 22.
Technical Levels: Supports and Resistances
XAUUSD currently trading at 1902.98 at the time of writing. Pair opened at 1904.16 and is trading with a change of -0.06 % .
| Overview | Overview.1 | |
|---|---|---|
| 0 | Today last price | 1902.98 |
| 1 | Today Daily Change | -1.18 |
| 2 | Today Daily Change % | -0.06 |
| 3 | Today daily open | 1904.16 |
The pair remains strongly bullish on the daily timeframe. It trades above its 20 SMA @ 1840.85, 50 SMA 1874.19, 100 SMA @ 1815.61 and 200 SMA @ 1775.68.
| Trends | Trends.1 | |
|---|---|---|
| 0 | Daily SMA20 | 1840.85 |
| 1 | Daily SMA50 | 1874.19 |
| 2 | Daily SMA100 | 1815.61 |
| 3 | Daily SMA200 | 1775.68 |
The previous day high was 1914.32 while the previous day low was 1895.43. The daily 38.2% Fib levels comes at 1902.65, expected to provide support. Similarly, the daily 61.8% fib level is at 1907.1, expected to provide resistance.
Note the levels of interest below:
- Pivot support is noted at 1894.95, 1885.75, 1876.06
- Pivot resistance is noted at 1913.84, 1923.53, 1932.73
| Levels | Levels.1 |
|---|---|
| Previous Daily High | 1914.32 |
| Previous Daily Low | 1895.43 |
| Previous Weekly High | 1870.09 |
| Previous Weekly Low | 1809.46 |
| Previous Monthly High | 1959.80 |
| Previous Monthly Low | 1804.76 |
| Daily Fibonacci 38.2% | 1902.65 |
| Daily Fibonacci 61.8% | 1907.10 |
| Daily Pivot Point S1 | 1894.95 |
| Daily Pivot Point S2 | 1885.75 |
| Daily Pivot Point S3 | 1876.06 |
| Daily Pivot Point R1 | 1913.84 |
| Daily Pivot Point R2 | 1923.53 |
| Daily Pivot Point R3 | 1932.73 |
[/s2If]
Join Our Telegram Group
")


