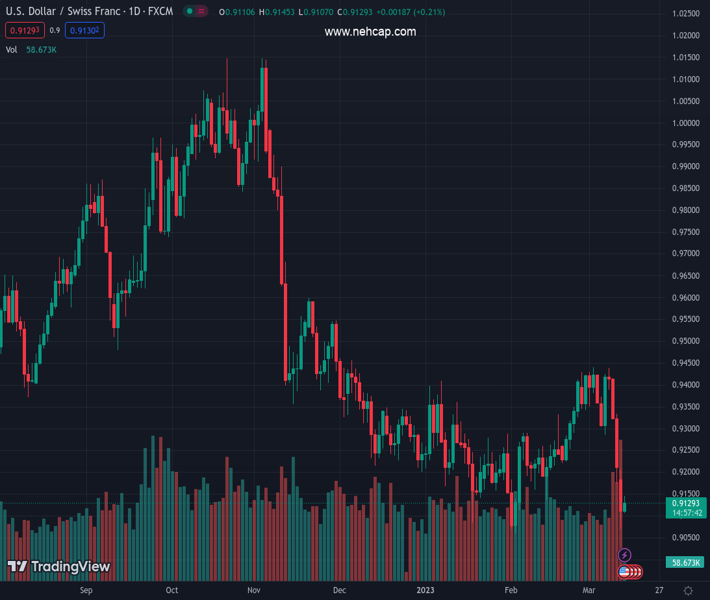
#USDCHF @ 0.91328 bounces off five-week low to print the first daily gain in five. (Pivot Orderbook analysis)
…
This is a premium post.
[s2If !current_user_can(access_s2member_level4)]Please register for PREMIUM VERSION HERE to read full post below containing analysis. In case of any error or you think you are not able to read the full post below, please email us at support#nehcap.com [lwa][/s2If] [s2If current_user_can(access_s2member_level4)]
- USD/CHF bounces off five-week low to print the first daily gain in five.
- US Dollar traces corrective bounce off yields to pare recent losses.
- Interest rate futures raise doubts on further USD/CHF advances unless US inflation markets notable jump.
The pair currently trades last at 0.91328.
The previous day high was 0.9214 while the previous day low was 0.9072. The daily 38.2% Fib levels comes at 0.9126, expected to provide support. Similarly, the daily 61.8% fib level is at 0.916, expected to provide resistance.
USD/CHF seesaws around intraday high during the first positive day in five heading into Tuesday’s European session.
In doing so, the Swiss Franc (CHF) pair traces the US Dollar’s latest corrective bounce amid a recovery in the US Treasury bond yields ahead of the Consumer Price Index (CPI) data. It should be noted, however, that the recently downbeat market concerns surrounding the Federal Reserve (Fed) seem to test the buyers ahead of the key US data.
That said, US 10-year Treasury bond yields print mild gains of around 3.58%, after bouncing off the monthly bottom of 3.418%, whereas the two-year counterpart rebounds from the lowest levels since September 2022 to print mild gains of around 4.19% by the press time. It should be noted that the US two-year Treasury bond yields dropped the most since 1987 the previous day.
A major slump in the US Treasury bond yields could be linked to the fears emanated from the Silicon Valley Bank (SVB) and the Signature Bank fallouts, despite the US authorities’ defense.
While talking about the Fed bets, CME said, “Traders see 33% chance Fed holds rates this month, market pricing shows rate cuts expected as early as June.” On the same line Reuters mentioned that yhe US Fed Fund Futures have priced in a 69% chance of a 25-bps hike at next week’s Fed policy meeting, with a more than 30% probability of a pause,” said Reuters. The news also added that the market last week was poised for a 50-bps increase prior to the SVB collapse.
Amid these plays, Wall Street closed mixed and so do stocks in the Asia-Pacific region while S&P 500 Future snap three-day downtrend by bouncing off the lowest levels since early January.
Looking ahead, the US CPI will be more important for the USD/CHF pair traders as the Fed bets have already reversed. As per the market forecasts, the headline US CPI is likely to ease to 6.0% YoY versus 6.4% prior while CPI ex Food & Energy may slide to 5.5% YoY from 5.6% prior.
Also read: US Inflation Preview: Five scenarios for trading the Core CPI whipsaw within the SVB storm
A clear downside break of the five-week-old ascending support line, now resistance around 0.9335, keeps USD/CHF bears hopeful of testing the previous monthly low of 0.9060.
Technical Levels: Supports and Resistances
USDCHF currently trading at 0.9138 at the time of writing. Pair opened at 0.9118 and is trading with a change of 0.22% % .
| Overview | Overview.1 | |
|---|---|---|
| 0 | Today last price | 0.9138 |
| 1 | Today Daily Change | 0.0020 |
| 2 | Today Daily Change % | 0.22% |
| 3 | Today daily open | 0.9118 |
The pair remains strongly bearish on the daily time frame. It trades below the 20 SMA @ 0.9315, 50 SMA 0.9264, 100 SMA @ 0.9393 and 200 SMA @ 0.9558.
| Trends | Trends.1 | |
|---|---|---|
| 0 | Daily SMA20 | 0.9315 |
| 1 | Daily SMA50 | 0.9264 |
| 2 | Daily SMA100 | 0.9393 |
| 3 | Daily SMA200 | 0.9558 |
The previous day high was 0.9214 while the previous day low was 0.9072. The daily 38.2% Fib levels comes at 0.9126, expected to provide support. Similarly, the daily 61.8% fib level is at 0.916, expected to provide resistance.
Note the levels of interest below:
- Pivot support is noted at 0.9055, 0.8992, 0.8913
- Pivot resistance is noted at 0.9198, 0.9277, 0.934
| Levels | Levels.1 |
|---|---|
| Previous Daily High | 0.9214 |
| Previous Daily Low | 0.9072 |
| Previous Weekly High | 0.9439 |
| Previous Weekly Low | 0.9175 |
| Previous Monthly High | 0.9429 |
| Previous Monthly Low | 0.9059 |
| Daily Fibonacci 38.2% | 0.9126 |
| Daily Fibonacci 61.8% | 0.9160 |
| Daily Pivot Point S1 | 0.9055 |
| Daily Pivot Point S2 | 0.8992 |
| Daily Pivot Point S3 | 0.8913 |
| Daily Pivot Point R1 | 0.9198 |
| Daily Pivot Point R2 | 0.9277 |
| Daily Pivot Point R3 | 0.9340 |
[/s2If]
Join Our Telegram Group
")


