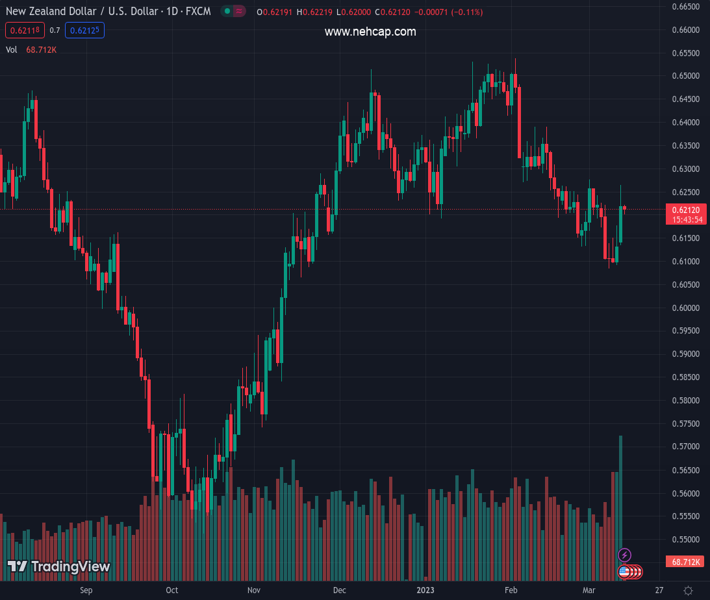
#NZDUSD @ 0.62128 holds lower ground near intraday low, snaps two-day winning streak., @nehcap view: Further downside expected (Pivot Orderbook analysis)
…
This is a premium post.
[s2If !current_user_can(access_s2member_level4)]Please register for PREMIUM VERSION HERE to read full post below containing analysis. In case of any error or you think you are not able to read the full post below, please email us at support#nehcap.com [lwa][/s2If] [s2If current_user_can(access_s2member_level4)]
- NZD/USD holds lower ground near intraday low, snaps two-day winning streak.
- RSI retreat backs the Kiwi pair’s U-turn from 200-EMA, one-month-long resistance line.
- Receding bullish bias of MACD signals, failure to cross key upside hurdles keep sellers hopeful.
- Fortnight-old horizontal support area lures bears past 100-EMA break.
The pair currently trades last at 0.62128.
The previous day high was 0.6265 while the previous day low was 0.6131. The daily 38.2% Fib levels comes at 0.6214, expected to provide resistance. Similarly, the daily 61.8% fib level is at 0.6182, expected to provide support.
NZD/USD sticks to mild losses near 0.6210 during the first downbeat day in three heading into Tuesday’s European session. In doing so, the Kiwi pair struggles to break the 100-bar Exponential Moving Average (EMA) amid sluggish trading hours.
That said, the quote rose the most in nine weeks the previous day before retreating from 0.6265. The pullback moves could be linked to the NZD/USD pair’s inability to cross the 200-bar EMA, as well as a downward-sloping resistance line from mid-February.
Adding strength to the pullback moves could be the RSI (14) retreat from the overbought territory, as well as the receding bullish bias of the MACD signals.
It’s worth noting, however, that a clear downside break of the 100-bar EMA, around 0.6200 by the press time, becomes necessary for the NZD/USD bears to take control.
Following that, a south-run towards the two-week-old horizontal support zone near 0.6130 and then to the monthly low of 0.6084 can’t be ruled out.
On the contrary, the aforementioned trend line and 200-EMA restrict short-term NZD/USD recovery to around 0.6230 and 0.6245 in that order.
In a case where NZD/USD remains firmer past 0.6245, the odds of witnessing a rally targeting the mid-February high of 0.6390 can’t be ruled out.
Trend: Further downside expected
Technical Levels: Supports and Resistances
NZDUSD currently trading at 0.621 at the time of writing. Pair opened at 0.622 and is trading with a change of -0.16% % .
| Overview | Overview.1 | |
|---|---|---|
| 0 | Today last price | 0.621 |
| 1 | Today Daily Change | -0.0010 |
| 2 | Today Daily Change % | -0.16% |
| 3 | Today daily open | 0.622 |
The pair is trading above its 20 Daily moving average @ 0.6206, below its 50 Daily moving average @ 0.6317 , below its 100 Daily moving average @ 0.6245 and above its 200 Daily moving average @ 0.6167
| Trends | Trends.1 | |
|---|---|---|
| 0 | Daily SMA20 | 0.6206 |
| 1 | Daily SMA50 | 0.6317 |
| 2 | Daily SMA100 | 0.6245 |
| 3 | Daily SMA200 | 0.6167 |
The previous day high was 0.6265 while the previous day low was 0.6131. The daily 38.2% Fib levels comes at 0.6214, expected to provide resistance. Similarly, the daily 61.8% fib level is at 0.6182, expected to provide support.
Note the levels of interest below:
- Pivot support is noted at 0.6145, 0.6071, 0.6011
- Pivot resistance is noted at 0.628, 0.6339, 0.6414
| Levels | Levels.1 |
|---|---|
| Previous Daily High | 0.6265 |
| Previous Daily Low | 0.6131 |
| Previous Weekly High | 0.6226 |
| Previous Weekly Low | 0.6084 |
| Previous Monthly High | 0.6538 |
| Previous Monthly Low | 0.6131 |
| Daily Fibonacci 38.2% | 0.6214 |
| Daily Fibonacci 61.8% | 0.6182 |
| Daily Pivot Point S1 | 0.6145 |
| Daily Pivot Point S2 | 0.6071 |
| Daily Pivot Point S3 | 0.6011 |
| Daily Pivot Point R1 | 0.6280 |
| Daily Pivot Point R2 | 0.6339 |
| Daily Pivot Point R3 | 0.6414 |
[/s2If]
Join Our Telegram Group
")


