Asian stocks have continued turmoil as the impact of the SVB collapse would take time in healing. (Pivot Orderbook analysis)
…
This is a premium post.
[s2If !current_user_can(access_s2member_level4)]Please register for PREMIUM VERSION HERE to read full post below containing analysis. In case of any error or you think you are not able to read the full post below, please email us at support#nehcap.com [lwa][/s2If] [s2If current_user_can(access_s2member_level4)]
- Asian stocks have continued turmoil as the impact of the SVB collapse would take time in healing.
- An upbeat Chinese Retail Sales data might propel hopes of economic recovery after the rollback of lockdown curbs.
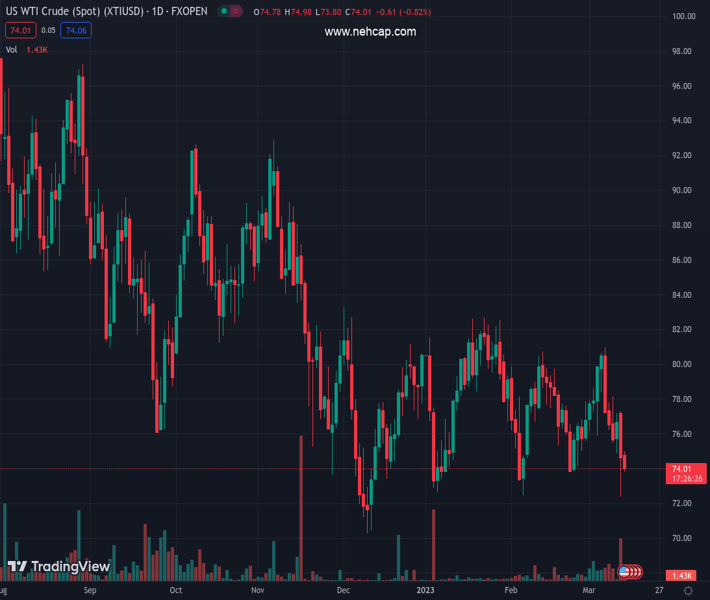
- Soaring fears of a recession in the US economy has pushed oil price lower to $74.00.
The pair currently trades last at 27421.23.
The previous day high was 27921.99 while the previous day low was 27229.61. The daily 38.2% Fib levels comes at 27494.1, expected to provide resistance. Similarly, the daily 61.8% fib level is at 27657.5, expected to provide resistance.
Markets in the Asian domain have continued their downside momentum as investors are dumping equities after the collapse of Silicon Valley Bank (SVG). Investors have drastically cut their exposure to banks and financial lenders in hopes that the delinquency costs could fuel further.
Higher rates from global central banks have accelerated interest obligations and a failure on them has resulted in a pile-up of Non-Performing Assets (NPAs). Bloomberg reported that the combined market capitalization of the Morgan Stanley Composite Index (MSCI) World Financials Index and MSCI Emerging Markets (EM) Financials Index has dropped about $465 billion in three days.
S&P500 futures have attempted a recovery in the Asian session after a subdued Monday, however, the 500-US stocks basket futures are failing to fuel optimism in the Asian indices.
At the press time, Nikkie225 nosedives 2.16%, ChinaA50 tumbles 0.76%, Hang Seng plunges 1.86%, while Nifty50 remains flat.
Japanese stocks have been witnessing a sheer sell-off after ex-Bank of Japan (BoJ) Governor Haruhiko Kuroda maintained a dovish policy amid an absence of recovery in the overall demand and the wages distributed. The street is expecting that novel BoJ Governor Kazuo Ueda would provide a roadmap of an exit from the Yield Curve Control (YCC) and the ultra-loose monetary policy, however, the process would be gradual as anticipated.
Chinese equities are likely to dance to the tunes of Wednesday’s Retail Sales (Feb) data. The economic data is expected to expand by 3.5% against a contraction of 1.8% displayed prior. An upbeat Retail Sales data might propel hopes of economic recovery in the Chinese economy after the rollback of lockdown curbs.
Global stocks will remain on tenterhooks ahead of the release of the United States Consumer Price Index (CPI) data, which is expected to increase at a reduced pace on a monthly basis.
The oil price has dropped to near $74.00 on hopes that the US economy will face a recession as higher rates by the Federal Reserve (Fed) are resulting in a dismal outlook.
Technical Levels: Supports and Resistances
XTIUSD currently trading at 27421.23 at the time of writing. Pair opened at 27421.23 and is trading with a change of 0.0 % .
| Overview | Overview.1 | |
|---|---|---|
| 0 | Today last price | 27421.23 |
| 1 | Today Daily Change | 0.00 |
| 2 | Today Daily Change % | 0.00 |
| 3 | Today daily open | 27421.23 |
The pair is trading below its 20 Daily moving average @ 27699.41, above its 50 Daily moving average @ 27226.32 , above its 100 Daily moving average @ 27359.21 and above its 200 Daily moving average @ 27353.78
| Trends | Trends.1 | |
|---|---|---|
| 0 | Daily SMA20 | 27699.41 |
| 1 | Daily SMA50 | 27226.32 |
| 2 | Daily SMA100 | 27359.21 |
| 3 | Daily SMA200 | 27353.78 |
The previous day high was 27921.99 while the previous day low was 27229.61. The daily 38.2% Fib levels comes at 27494.1, expected to provide resistance. Similarly, the daily 61.8% fib level is at 27657.5, expected to provide resistance.
Note the levels of interest below:
- Pivot support is noted at 27126.56, 26831.9, 26434.18
- Pivot resistance is noted at 27818.94, 28216.66, 28511.32
| Levels | Levels.1 |
|---|---|
| Previous Daily High | 27921.99 |
| Previous Daily Low | 27229.61 |
| Previous Weekly High | 28630.69 |
| Previous Weekly Low | 27748.31 |
| Previous Monthly High | 27812.68 |
| Previous Monthly Low | 26985.47 |
| Daily Fibonacci 38.2% | 27494.10 |
| Daily Fibonacci 61.8% | 27657.50 |
| Daily Pivot Point S1 | 27126.56 |
| Daily Pivot Point S2 | 26831.90 |
| Daily Pivot Point S3 | 26434.18 |
| Daily Pivot Point R1 | 27818.94 |
| Daily Pivot Point R2 | 28216.66 |
| Daily Pivot Point R3 | 28511.32 |
[/s2If]
Join Our Telegram Group
")


