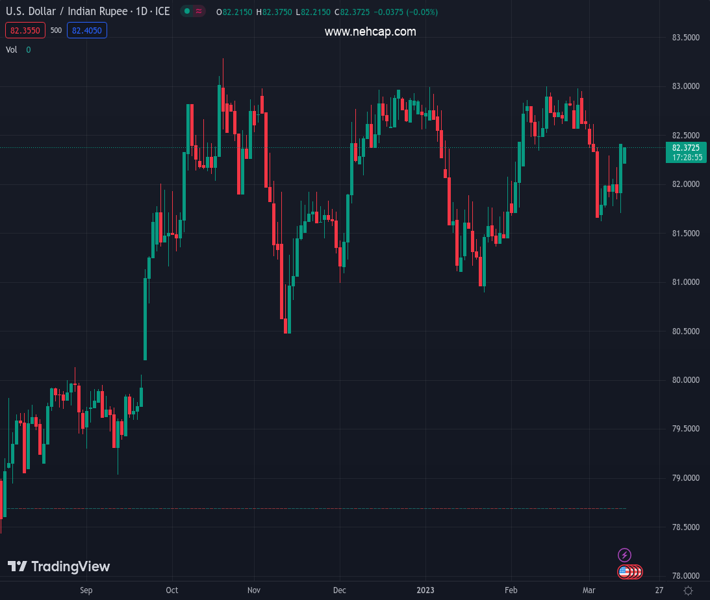
#USDINR @ 82.3725 pares the biggest daily gains in seven weeks amid sluggish session. (Pivot Orderbook analysis)
…
This is a premium post.
[s2If !current_user_can(access_s2member_level4)]Please register for PREMIUM VERSION HERE to read full post below containing analysis. In case of any error or you think you are not able to read the full post below, please email us at support#nehcap.com [lwa][/s2If] [s2If current_user_can(access_s2member_level4)]
- USD/INR pares the biggest daily gains in seven weeks amid sluggish session.
- Indian equity rout, downbeat inflation data drowned Rupee the previous day despite broad US Dollar weakness.
- Fed pivot chatters highlight US CPI for February as SVB-led market fears ease.
The pair currently trades last at 82.3725.
The previous day high was 82.42 while the previous day low was 81.512. The daily 38.2% Fib levels comes at 82.0731, expected to provide support. Similarly, the daily 61.8% fib level is at 81.8589, expected to provide support.
USD/INR sticks to mild losses near 82.35 as it consolidates the biggest daily gain in nearly two months during early Tuesday. In doing so, the Indian Rupee pair takes clues from the receding fears of hawkish Fed rate moves amid a sluggish session ahead of the US Consumer Price Index (CPI) data for February.
Interest rate futures hint at the US Federal Reserve’s (Fed) policy pivot, especially after the recent fallout of the Silicon Valley Bank (SVB) and the Signature Bank. “The US Fed Fund Futures have priced in a 69% chance of a 25-bps hike at next week’s Fed policy meeting, with a more than 30% probability of a pause,” said Reuters while also adding that the market last week was poised for a 50-bps increase prior to the SVB collapse. On the same line could be the CME as it mentioned, “Traders see 33% chance Fed holds rates this month, market pricing shows rate cuts expected as early as June.”
On the other hand, the US Treasury bond yields’ corrective bounce should have underpinned the USD/INR pair’s run-up but couldn’t as the Indian Rupee (INR) pares the previous day’s gains, mainly levied due to the downbeat India Inflation data and the equity market rout.
That said, India Consumer Price Index (CPI) for February, rose 6.44% YoY versus 6.35% expected and 6.52% prior. The receding inflation fears raised concerns that the Reserve Bank of India (RBI) may refrain from further rate hikes now that the Fed bets suggest a policy pivot. Even so, the Indian equities failed to cheer receding hopes of hawkish monetary policy actions amid the equity rout during early Monday. It should be noted that India’s benchmark BSE Sensex dropped to the five-month low the previous day before printing mild gains of around 58,300 by the press time.
On a macro level, traders witnessed heavy bond buying the previous day as the US banking regulators rushed to defend the SVB and the Signature Bank after their fallouts. US banking regulators undertook joint actions to tame the risks emanating from SVB and Signature Bank during the weekend. While announcing the plan, US President Joe Biden noted on Monday that investors in those banks will not be protected and reminded that “no one is above the law.” However, the US President also vowed to take whatever action was needed to ensure the safety of the US banking system, per Reuters.
Amid these plays, Wall Street closed mixed and the S&P 500 Futures print mild gains at the latest.
Moving forward, India’s WPI inflation for February will precede the US CPI for the said month to direct immediate USD/INR moves. Given the latest blow to the hawkish Fed bets, any more softening of the US inflation numbers could allow the pair to recall the sellers.
A daily closing beyond the convergence of the 100-DMA and 50-DMA, around 82.15-10 by the press time, keeps USD/INR bulls hopeful.
Technical Levels: Supports and Resistances
USDINR currently trading at 82.3565 at the time of writing. Pair opened at 82.4111 and is trading with a change of -0.07% % .
| Overview | Overview.1 | |
|---|---|---|
| 0 | Today last price | 82.3565 |
| 1 | Today Daily Change | -0.0546 |
| 2 | Today Daily Change % | -0.07% |
| 3 | Today daily open | 82.4111 |
The pair is trading below its 20 Daily moving average @ 82.4651, above its 50 Daily moving average @ 82.1435 , above its 100 Daily moving average @ 82.1217 and above its 200 Daily moving average @ 81.0112
| Trends | Trends.1 | |
|---|---|---|
| 0 | Daily SMA20 | 82.4651 |
| 1 | Daily SMA50 | 82.1435 |
| 2 | Daily SMA100 | 82.1217 |
| 3 | Daily SMA200 | 81.0112 |
The previous day high was 82.42 while the previous day low was 81.512. The daily 38.2% Fib levels comes at 82.0731, expected to provide support. Similarly, the daily 61.8% fib level is at 81.8589, expected to provide support.
Note the levels of interest below:
- Pivot support is noted at 81.8087, 81.2064, 80.9007
- Pivot resistance is noted at 82.7167, 83.0224, 83.6247
| Levels | Levels.1 |
|---|---|
| Previous Daily High | 82.4200 |
| Previous Daily Low | 81.5120 |
| Previous Weekly High | 82.3126 |
| Previous Weekly Low | 81.6120 |
| Previous Monthly High | 83.0820 |
| Previous Monthly Low | 81.5032 |
| Daily Fibonacci 38.2% | 82.0731 |
| Daily Fibonacci 61.8% | 81.8589 |
| Daily Pivot Point S1 | 81.8087 |
| Daily Pivot Point S2 | 81.2064 |
| Daily Pivot Point S3 | 80.9007 |
| Daily Pivot Point R1 | 82.7167 |
| Daily Pivot Point R2 | 83.0224 |
| Daily Pivot Point R3 | 83.6247 |
[/s2If]
Join Our Telegram Group
")


