Gold price looks comfortable above the $1,900 mark and obeying the yields. (Pivot Orderbook analysis)
…
This is a premium post.
[s2If !current_user_can(access_s2member_level4)]Please register for PREMIUM VERSION HERE to read full post below containing analysis. In case of any error or you think you are not able to read the full post below, please email us at support#nehcap.com [lwa][/s2If] [s2If current_user_can(access_s2member_level4)]
- Gold price looks comfortable above the $1,900 mark and obeying the yields.
- SVB fallout and underlying financial dents receding bets for a 50-bps Fed hike.
- Stronger US CPI reading can put Fed into doom and gloom.
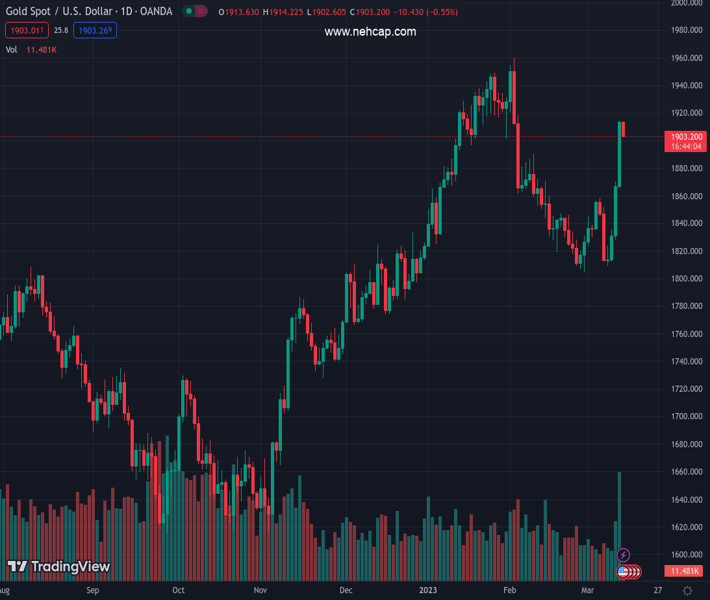
The pair currently trades last at 1903.0.
The previous day high was 1914.67 while the previous day low was 1867.66. The daily 38.2% Fib levels comes at 1896.71, expected to provide support. Similarly, the daily 61.8% fib level is at 1885.62, expected to provide support.
XAU/USD took a breather after three days of successive rallies. Gold price is slightly down on the day after hitting a fresh monthly high around the $1,915 mark, amidst falling US Treasury bond yields.
Gold is commonly recognized as an asset that has an inverse correlation with US Treasury (UST) bond yields, but its correlation with real UST bond yields is stronger than with nominal yields.
Emphasizing the inter-market correlation, fallouts of Silicon Valley Bank (SVB), and speculations around the deteriorating US financial system are prompting the market participants to scale out the bets for an aggressive rate-hiking path from Federal Reserve (Fed). UST yields have been gravitating toward the downside upon dwindling bets of a 50 basis point rate hike from the Fed at the March 22 meeting.
Following the fallout of SVB and muted Fed commentary, investors are likely to remain indecisive until the Fed provides more clarity on the spread of the contagion in the US banking sector.
Starting from Monday, many market forecasters have shifted their view on the Fed rate hiking plan and it seems the market is not finding a consensus view for the March FOMC meeting.
One argument favors the Fed’s rate hiking cycles on the urge of “whatever it takes to do” to tame inflation. On the other side, the Fed cannot keep going on when underlying dents from the financial system are cultivating.
Meanwhile, the US economic calendar features the US Consumer Price Index (CPI) data for February. Attention will focus on the sticky service-led inflationary portion, which has the Fed’s focus.
In general, service-the led inflationary part has irreversibility and most of the developed economies are heavily dependent on the service sector, therefore, the Fed will be in a tricky situation if the inflation reading comes in higher than expected.
Technical Levels: Supports and Resistances
XAUUSD currently trading at 1903.0 at the time of writing. Pair opened at 1913.77 and is trading with a change of -0.56 % .
| Overview | Overview.1 | |
|---|---|---|
| 0 | Today last price | 1903.00 |
| 1 | Today Daily Change | -10.77 |
| 2 | Today Daily Change % | -0.56 |
| 3 | Today daily open | 1913.77 |
The pair remains strongly bullish on the daily timeframe. It trades above its 20 SMA @ 1838.45, 50 SMA 1872.87, 100 SMA @ 1813.1 and 200 SMA @ 1775.42.
| Trends | Trends.1 | |
|---|---|---|
| 0 | Daily SMA20 | 1838.45 |
| 1 | Daily SMA50 | 1872.87 |
| 2 | Daily SMA100 | 1813.10 |
| 3 | Daily SMA200 | 1775.42 |
The previous day high was 1914.67 while the previous day low was 1867.66. The daily 38.2% Fib levels comes at 1896.71, expected to provide support. Similarly, the daily 61.8% fib level is at 1885.62, expected to provide support.
Note the levels of interest below:
- Pivot support is noted at 1882.73, 1851.69, 1835.72
- Pivot resistance is noted at 1929.74, 1945.71, 1976.75
| Levels | Levels.1 |
|---|---|
| Previous Daily High | 1914.67 |
| Previous Daily Low | 1867.66 |
| Previous Weekly High | 1870.09 |
| Previous Weekly Low | 1809.46 |
| Previous Monthly High | 1959.80 |
| Previous Monthly Low | 1804.76 |
| Daily Fibonacci 38.2% | 1896.71 |
| Daily Fibonacci 61.8% | 1885.62 |
| Daily Pivot Point S1 | 1882.73 |
| Daily Pivot Point S2 | 1851.69 |
| Daily Pivot Point S3 | 1835.72 |
| Daily Pivot Point R1 | 1929.74 |
| Daily Pivot Point R2 | 1945.71 |
| Daily Pivot Point R3 | 1976.75 |
[/s2If]
Join Our Telegram Group
")


