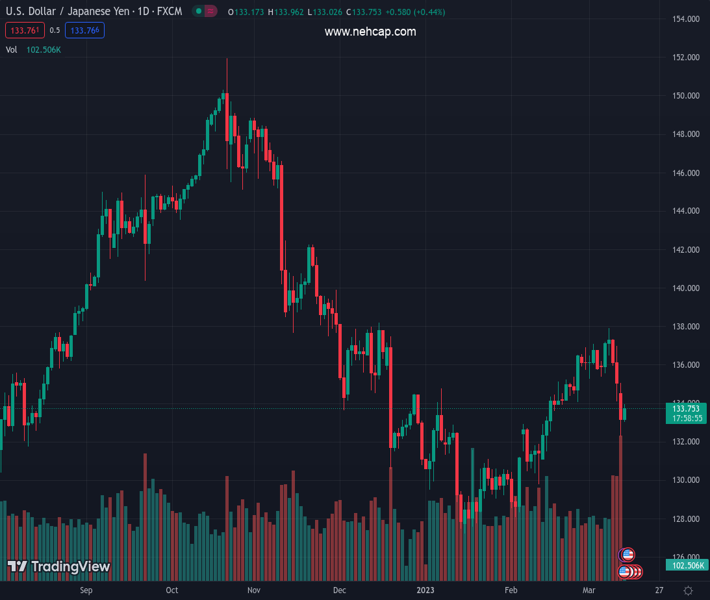
#USDJPY @ 133.684 picks up bids to rebound from one-month low, snaps three-day downtrend. (Pivot Orderbook analysis)
…
This is a premium post.
[s2If !current_user_can(access_s2member_level4)]Please register for PREMIUM VERSION HERE to read full post below containing analysis. In case of any error or you think you are not able to read the full post below, please email us at support#nehcap.com [lwa][/s2If] [s2If current_user_can(access_s2member_level4)]
- USD/JPY picks up bids to rebound from one-month low, snaps three-day downtrend.
- Markets consolidate SVB-led moves amid mixed concerns surrounding Fed.
- US two-year Treasury bond yields pare the biggest daily loss since October 1987.
- Receding fears of US financial crisis contagion, optimism for China recovery also favor Yen buyers.
The pair currently trades last at 133.684.
The previous day high was 135.05 while the previous day low was 132.29. The daily 38.2% Fib levels comes at 133.34, expected to provide support. Similarly, the daily 61.8% fib level is at 133.99, expected to provide resistance.
USD/JPY clings to mild gains around 133.70 as it snaps a three-day downtrend with a bounce off the one-month low marked the previous day. In doing so, the Yen pair cheers the market’s consolidation of the moves induced by the US actions to tame fears emanating from the Silicon Valley Bank (SVB) and the Signature Bank. Adding strength to the quote’s rebound could be the recent recovery in the US Treasury bond yields after the previous day’s bond market havoc.
That said, the US 10-year Treasury bond yields seesaw around 3.56%, after bouncing off the monthly bottom of 3.418%, whereas the two-year counterpart rebounds from the lowest levels since September 2022 to print mild gains of around 4.05% by the press time. It should be noted that the US two-year Treasury bond yields dropped the most since 1987 the previous day while the latest rebound could be a U-turn from the 200-DMA support ahead of important US data.
It should be noted that the traders witnessed heavy bond buying the previous day as the US banking regulators rushed to defend the Silicon Valley Bank (SVB) and the Signature Bank after their fallouts. US banking regulators undertook joint actions to tame the risks emanating from SVB and Signature Bank during the weekend. While announcing the plan, US President Joe Biden noted on Monday that investors in those banks will not be protected and reminded that “no one is above the law.” However, the US President also vowed to take whatever action was needed to ensure the safety of the US banking system, per Reuters.
However, the policymakers from the UK and Europe, as well as some of the Asia-Pacific majors, have ruled out the odds of witnessing a financial crisis at home after the SVB saga, which in turn might have also pleased the USD/JPY buyers of late.
Alternatively, receding hawkish Fed bets and downbeat US inflation expectations join the market’s jittery status amid the US-China tensions and SVB talks seem to challenge the USD/JPY buyers.
Also read: US inflation expectations drop to five-week low ahead of CPI release
Above all, the Yen pair traders seem to position themselves for the US CPI. However, major attention should be given to the risk catalysts and the yields. That said, the US CPI is likely to ease to 6.0% YoY versus 6.4% prior while CPI ex Food & Energy may slide to 5.5% YoY from 5.6% prior.
Also read: US Inflation Preview: Five scenarios for trading the Core CPI whipsaw within the SVB storm
Although the 50-DMA restricts immediate downside of the USD/JPY pair around 132.50, the recovery moves remain elusive unless staying below the previous support line from early February, around 136.20 by the press time.
Technical Levels: Supports and Resistances
USDJPY currently trading at 133.76 at the time of writing. Pair opened at 133.2 and is trading with a change of 0.42% % .
| Overview | Overview.1 | |
|---|---|---|
| 0 | Today last price | 133.76 |
| 1 | Today Daily Change | 0.56 |
| 2 | Today Daily Change % | 0.42% |
| 3 | Today daily open | 133.2 |
The pair is trading below its 20 Daily moving average @ 135.3, above its 50 Daily moving average @ 132.46 , below its 100 Daily moving average @ 135.83 and below its 200 Daily moving average @ 137.49
| Trends | Trends.1 | |
|---|---|---|
| 0 | Daily SMA20 | 135.30 |
| 1 | Daily SMA50 | 132.46 |
| 2 | Daily SMA100 | 135.83 |
| 3 | Daily SMA200 | 137.49 |
The previous day high was 135.05 while the previous day low was 132.29. The daily 38.2% Fib levels comes at 133.34, expected to provide support. Similarly, the daily 61.8% fib level is at 133.99, expected to provide resistance.
Note the levels of interest below:
- Pivot support is noted at 131.97, 130.75, 129.21
- Pivot resistance is noted at 134.74, 136.28, 137.5
| Levels | Levels.1 |
|---|---|
| Previous Daily High | 135.05 |
| Previous Daily Low | 132.29 |
| Previous Weekly High | 137.91 |
| Previous Weekly Low | 134.12 |
| Previous Monthly High | 136.92 |
| Previous Monthly Low | 128.08 |
| Daily Fibonacci 38.2% | 133.34 |
| Daily Fibonacci 61.8% | 133.99 |
| Daily Pivot Point S1 | 131.97 |
| Daily Pivot Point S2 | 130.75 |
| Daily Pivot Point S3 | 129.21 |
| Daily Pivot Point R1 | 134.74 |
| Daily Pivot Point R2 | 136.28 |
| Daily Pivot Point R3 | 137.50 |
[/s2If]
Join Our Telegram Group
")


