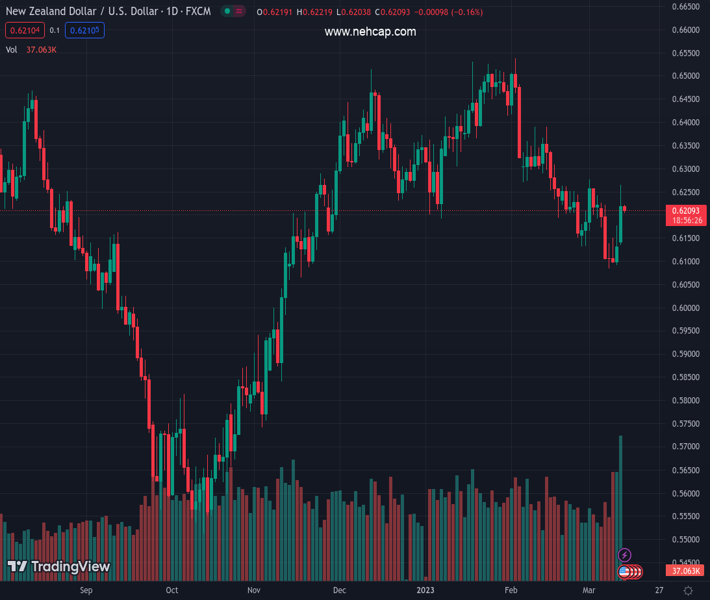
#NZDUSD @ 0.62088 has slipped below 0.6200 amid a recovery in the USD Index. (Pivot Orderbook analysis)
…
This is a premium post.
[s2If !current_user_can(access_s2member_level4)]Please register for PREMIUM VERSION HERE to read full post below containing analysis. In case of any error or you think you are not able to read the full post below, please email us at support#nehcap.com [lwa][/s2If] [s2If current_user_can(access_s2member_level4)]
- NZD/USD has slipped below 0.6200 amid a recovery in the USD Index.
- Investors have started ignoring the volatility associated with the SVB collapse.
- As per the estimates, the NZ economy contracted by 0.2% in the fourth quarter.
The pair currently trades last at 0.62088.
The previous day high was 0.6265 while the previous day low was 0.6131. The daily 38.2% Fib levels comes at 0.6214, expected to provide resistance. Similarly, the daily 61.8% fib level is at 0.6182, expected to provide support.
The NZD/USD pair has extended its correction below 0.6220 in the Asian session. The Kiwi asset is expected to display sheer volatility ahead as investors are getting anxious ahead of the release of the United States Consumer Price Index (CPI) data.
After a surprise jump in the number of payrolls generated in the US economy in the month of February and a less-than-anticipated jump in the Average Earnings, an increase in inflationary pressures cannot be ruled out. However, the consensus shows a decline in the headline CPI to 6.0% from the former release of 6.4%. And, the core inflation that strips off oil and food prices is expected to soften marginally to 5.5% vs. the prior release of 5.6%.
The US Dollar Index (DXY) has shown a recovery to near 103.80, which seems like a pullback move after a vertical sell-off. Economists at MUFG Bank believe that only a big surprise upside in the US inflation could lift the US Dollar ahead. S&P500 futures are showing a decent recovery as investors are ignoring the volatility linked to Silicon Valley Bank (SVB) collapse. Also, the demand for US government bonds has dropped, which has led to a rebound in the 10-year US Treasury yields above 3.55%.
On the New Zealand Dollar front, investors are awaiting the release of the Gross Domestic Product (GDP) (Q4). According to the estimates, the NZ economy has contracted by 0.2% vs. a growth of 2.0% witnessed in the third quarter. The annual GDP (Q4) has expanded by 3.3%, lower than the prior expansion of 6.4%.
Technical Levels: Supports and Resistances
NZDUSD currently trading at 0.6212 at the time of writing. Pair opened at 0.622 and is trading with a change of -0.13 % .
| Overview | Overview.1 | |
|---|---|---|
| 0 | Today last price | 0.6212 |
| 1 | Today Daily Change | -0.0008 |
| 2 | Today Daily Change % | -0.1300 |
| 3 | Today daily open | 0.6220 |
The pair is trading above its 20 Daily moving average @ 0.6206, below its 50 Daily moving average @ 0.6317 , below its 100 Daily moving average @ 0.6245 and above its 200 Daily moving average @ 0.6167
| Trends | Trends.1 | |
|---|---|---|
| 0 | Daily SMA20 | 0.6206 |
| 1 | Daily SMA50 | 0.6317 |
| 2 | Daily SMA100 | 0.6245 |
| 3 | Daily SMA200 | 0.6167 |
The previous day high was 0.6265 while the previous day low was 0.6131. The daily 38.2% Fib levels comes at 0.6214, expected to provide resistance. Similarly, the daily 61.8% fib level is at 0.6182, expected to provide support.
Note the levels of interest below:
- Pivot support is noted at 0.6145, 0.6071, 0.6011
- Pivot resistance is noted at 0.628, 0.6339, 0.6414
| Levels | Levels.1 |
|---|---|
| Previous Daily High | 0.6265 |
| Previous Daily Low | 0.6131 |
| Previous Weekly High | 0.6226 |
| Previous Weekly Low | 0.6084 |
| Previous Monthly High | 0.6538 |
| Previous Monthly Low | 0.6131 |
| Daily Fibonacci 38.2% | 0.6214 |
| Daily Fibonacci 61.8% | 0.6182 |
| Daily Pivot Point S1 | 0.6145 |
| Daily Pivot Point S2 | 0.6071 |
| Daily Pivot Point S3 | 0.6011 |
| Daily Pivot Point R1 | 0.6280 |
| Daily Pivot Point R2 | 0.6339 |
| Daily Pivot Point R3 | 0.6414 |
[/s2If]
Join Our Telegram Group
")


