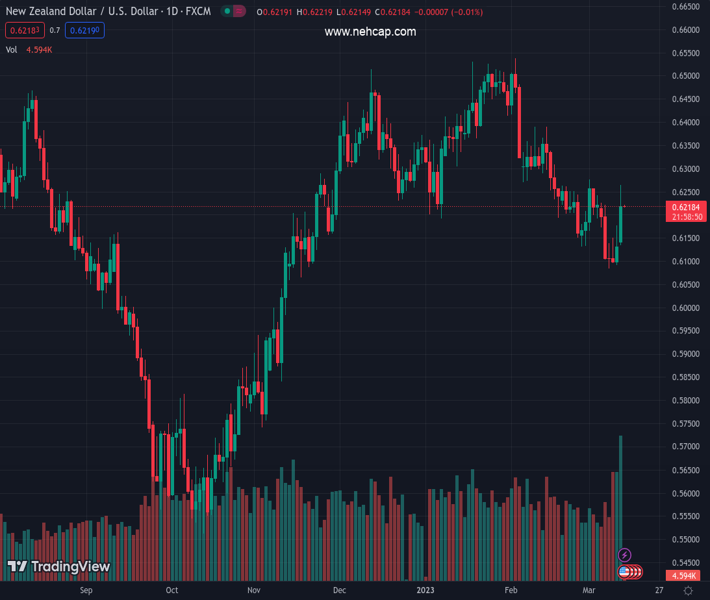
#NZDUSD @ 0.62176 is oscillating around 0.6220, resumption in the upside is expected ahead of US CPI. (Pivot Orderbook analysis)
…
This is a premium post.
[s2If !current_user_can(access_s2member_level4)]Please register for PREMIUM VERSION HERE to read full post below containing analysis. In case of any error or you think you are not able to read the full post below, please email us at support#nehcap.com [lwa][/s2If] [s2If current_user_can(access_s2member_level4)]
- NZD/USD is oscillating around 0.6220, resumption in the upside is expected ahead of US CPI.
- After a responsive buying, NZD/USD has negated the breakdown of the Double Top chart pattern.
- A decent recovery from the RSI (14) into the 40.00-60.00 range indicates that the presence of responsive buyers.
The pair currently trades last at 0.62176.
The previous day high was 0.6177 while the previous day low was 0.6091. The daily 38.2% Fib levels comes at 0.6144, expected to provide support. Similarly, the daily 61.8% fib level is at 0.6124, expected to provide support.
The NZD/USD pair has turned sideways around 0.6220 in the early Tokyo session after a corrective move from 0.6260. A resumption in the upside momentum is expected from the Kiwi asset as the catastrophic collapse of Silicon Valley Bank (SVB) has faded the hopes of a hawkish stance on the interest rates by the Federal Reserve (Fed).
On the interest rate hike outlook, Goldman Sachs believes “In light of recent stress in the banking system, we no longer expect the FOMC to deliver a rate hike at its March 22 meeting with considerable uncertainty about the path beyond March.”
A decent rebound is shown by the S&P500 futures, indicating an improvement in the risk appetite of the market participants. However, caution on a broad basis cannot be ruled out.
The US Dollar Index (DXY) has shown a less-confident recovery from 103.50 and is expected to remain volatile ahead of the release of the Consumer Price Index (CPI) ahead.
NZD/USD has negated the breakdown of the Double Top chart pattern formed on a daily scale. A responsive buying in the Kiwi asset has pushed it above the critical resistance plotted from January 06 low at 0.6190.
The asset is attempting to shift its auction above the 20-period Exponential Moving Average (EMA) at 0.6207, which will improve the short-term upside bias.
A decent recovery from the Relative Strength Index (RSI (14) into the 40.00-60.00 range indicates that the presence of responsive buyers at lower levels.
A buying opportunity in the Kiwi asset will emerge it will surpass March 1 high at 0.6276, which will drive the pair toward the round-level resistance at 0.6300 followed by February 14 high at 0.6389.
In an alternate scenario, a breakdown of January 6 low at 0.6193 will drag the asset toward November 28 low at 0.6155. A slippage below the latter will expose the asset for more downside toward the round-level support at 0.6100.
Technical Levels: Supports and Resistances
NZDUSD currently trading at 0.6217 at the time of writing. Pair opened at 0.6132 and is trading with a change of 1.39 % .
| Overview | Overview.1 | |
|---|---|---|
| 0 | Today last price | 0.6217 |
| 1 | Today Daily Change | 0.0085 |
| 2 | Today Daily Change % | 1.3900 |
| 3 | Today daily open | 0.6132 |
The pair is trading above its 20 Daily moving average @ 0.6213, below its 50 Daily moving average @ 0.6319 , below its 100 Daily moving average @ 0.624 and above its 200 Daily moving average @ 0.6168
| Trends | Trends.1 | |
|---|---|---|
| 0 | Daily SMA20 | 0.6213 |
| 1 | Daily SMA50 | 0.6319 |
| 2 | Daily SMA100 | 0.6240 |
| 3 | Daily SMA200 | 0.6168 |
The previous day high was 0.6177 while the previous day low was 0.6091. The daily 38.2% Fib levels comes at 0.6144, expected to provide support. Similarly, the daily 61.8% fib level is at 0.6124, expected to provide support.
Note the levels of interest below:
- Pivot support is noted at 0.609, 0.6047, 0.6004
- Pivot resistance is noted at 0.6176, 0.6219, 0.6262
| Levels | Levels.1 |
|---|---|
| Previous Daily High | 0.6177 |
| Previous Daily Low | 0.6091 |
| Previous Weekly High | 0.6226 |
| Previous Weekly Low | 0.6084 |
| Previous Monthly High | 0.6538 |
| Previous Monthly Low | 0.6131 |
| Daily Fibonacci 38.2% | 0.6144 |
| Daily Fibonacci 61.8% | 0.6124 |
| Daily Pivot Point S1 | 0.6090 |
| Daily Pivot Point S2 | 0.6047 |
| Daily Pivot Point S3 | 0.6004 |
| Daily Pivot Point R1 | 0.6176 |
| Daily Pivot Point R2 | 0.6219 |
| Daily Pivot Point R3 | 0.6262 |
[/s2If]
Join Our Telegram Group
")


