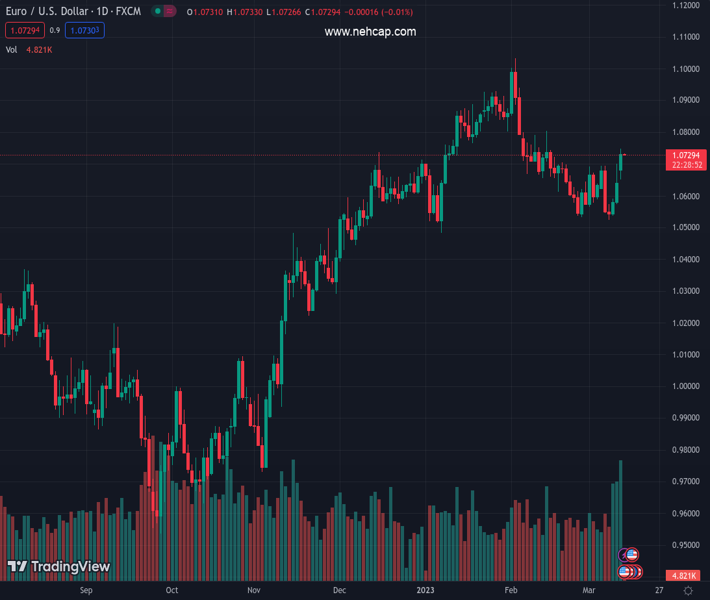
#EURUSD @ 1.07298 seesaws near one-month high after rising the most in two weeks the previous day. (Pivot Orderbook analysis)
…
This is a premium post.
[s2If !current_user_can(access_s2member_level4)]Please register for PREMIUM VERSION HERE to read full post below containing analysis. In case of any error or you think you are not able to read the full post below, please email us at support#nehcap.com [lwa][/s2If] [s2If current_user_can(access_s2member_level4)]
- EUR/USD seesaws near one-month high after rising the most in two weeks the previous day.
- US Dollar traces downbeat Treasury bond yields as SVB, Signature Bank fallout weigh on Fed bets.
- Market sentiment dwindles amid fears of looming financial market crisis.
- US inflation could offer immediate directions, firmer prints can put a floor under Euro prices.
The pair currently trades last at 1.07298.
The previous day high was 1.0701 while the previous day low was 1.0574. The daily 38.2% Fib levels comes at 1.0652, expected to provide support. Similarly, the daily 61.8% fib level is at 1.0622, expected to provide support.
EUR/USD grinds near the highest level in a month, after posting the biggest daily gains in a fortnight, as the US inflation data loom. That said, the Euro pair cheered the broad US Dollar strength to rally to 1.0741 the previous day before portraying the market’s cautious mood while making rounds to 1.0720-30 at the latest.
US Dollar Index (DXY) began the week’s trading on a back foot, printing a three-day south-run while declining the most in two months on Monday. In doing so, the greenback’s gauge versus the six major currencies traced the US Treasury bond yields as hawkish bets on the Federal Reserve (Fed) reverberates.
US 10-year Treasury bond yields slumped to the monthly low whereas the two-year counterpart marked above 13.0% daily slump amid a sudden shift in the market’s Fed bets due to the fallout of the Silicon Valley Bank (SVB) and the Signature Bank. “The two-year note’s yield, which reflects interest rate move expectations, was on track for the biggest one-day drop since October 1987 in the wake of that fateful Black Monday stock market crash,” said Reuters.
That said, the Fed Fund Futures suggest the 80 basis points (bps) of rate cuts by the end of 2023, versus a 50 bps rate hike in the next meeting expected previously. With this, the interest rate futures seem to ignore the latest jump in the US employment data and rather bear the burden of the position unwinding amid fears of another financial market crackdown.
Elsewhere, Wall Street closed mixed while Gold managed to remain firmer amid broad US Dollar weakness, as well as due to the metal’s traditional safe-haven status.
It should be noted that the US Treasury Department, Federal Reserve and the Federal Deposit Insurance Corporation (FDIC) undertook joint actions to tame the risks emanating from SVB and Signature Bank during the weekend. While announcing the plan, US President Joe Biden noted on Monday that investors in those banks will not be protected and reminded that “no one is above the law.”
Moving on, US Consumer Price Index (CPI) for February will be important to watch for clear directions. However, major attention will be on the SVB and Signature Bank updates. “Amid this financial uncertainty, US February CPI data will be out tonight. The consensus is for core CPI to slow just 0.1ppt to 5.5% y/y. That would indicate progress in bringing inflation back to target is proving very slow. Combined with a hot February Nonfarm Payrolls print, and we retain our forecast for a 25bp FFR hike next week (and a peak of 5.5% in June),” said Analysts at the ANZ ahead of the US CPI release.
Also raed: US Inflation Preview: Five scenarios for trading the Core CPI whipsaw within the SVB storm
The first daily closing beyond the 50-DMA, around 1.0725 by the press time, keeps EUR/USD buyers hopeful of poking the mid-February swing high surrounding 1.0805.
Technical Levels: Supports and Resistances
EURUSD currently trading at 1.0728 at the time of writing. Pair opened at 1.0637 and is trading with a change of 0.86% % .
| Overview | Overview.1 | |
|---|---|---|
| 0 | Today last price | 1.0728 |
| 1 | Today Daily Change | 0.0091 |
| 2 | Today Daily Change % | 0.86% |
| 3 | Today daily open | 1.0637 |
The pair remains strongly bullish on the daily timeframe. It trades above its 20 SMA @ 1.0634, 50 SMA 1.0722, 100 SMA @ 1.0534 and 200 SMA @ 1.0326.
| Trends | Trends.1 | |
|---|---|---|
| 0 | Daily SMA20 | 1.0634 |
| 1 | Daily SMA50 | 1.0722 |
| 2 | Daily SMA100 | 1.0534 |
| 3 | Daily SMA200 | 1.0326 |
The previous day high was 1.0701 while the previous day low was 1.0574. The daily 38.2% Fib levels comes at 1.0652, expected to provide support. Similarly, the daily 61.8% fib level is at 1.0622, expected to provide support.
Note the levels of interest below:
- Pivot support is noted at 1.0574, 1.0511, 1.0447
- Pivot resistance is noted at 1.07, 1.0764, 1.0827
| Levels | Levels.1 |
|---|---|
| Previous Daily High | 1.0701 |
| Previous Daily Low | 1.0574 |
| Previous Weekly High | 1.0701 |
| Previous Weekly Low | 1.0524 |
| Previous Monthly High | 1.1033 |
| Previous Monthly Low | 1.0533 |
| Daily Fibonacci 38.2% | 1.0652 |
| Daily Fibonacci 61.8% | 1.0622 |
| Daily Pivot Point S1 | 1.0574 |
| Daily Pivot Point S2 | 1.0511 |
| Daily Pivot Point S3 | 1.0447 |
| Daily Pivot Point R1 | 1.0700 |
| Daily Pivot Point R2 | 1.0764 |
| Daily Pivot Point R3 | 1.0827 |
[/s2If]
Join Our Telegram Group
")


