Western Texas Intermediate drops almost 3% on possible US financial crisis risks. (Pivot Orderbook analysis)
…
This is a premium post.
[s2If !current_user_can(access_s2member_level4)]Please register for PREMIUM VERSION HERE to read full post below containing analysis. In case of any error or you think you are not able to read the full post below, please email us at support#nehcap.com [lwa][/s2If] [s2If current_user_can(access_s2member_level4)]
- Western Texas Intermediate drops almost 3% on possible US financial crisis risks.
- A weaker US Dollar put a lid on WTI’s price.
- WTI Price Analysis: Can test March’s lows around $72.30s.
The pair currently trades last at 74.69.
The previous day high was 77.18 while the previous day low was 74.89. The daily 38.2% Fib levels comes at 76.31, expected to provide resistance. Similarly, the daily 61.8% fib level is at 75.77, expected to provide resistance.
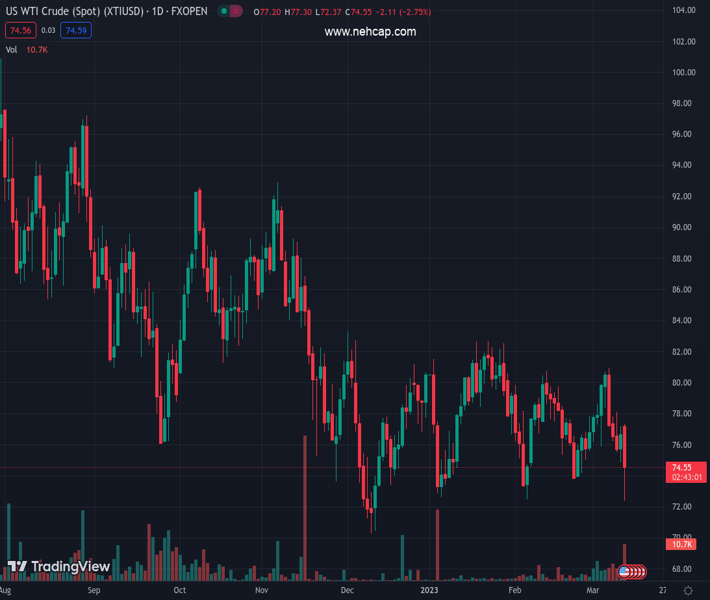
Western Texas Intermediate (WTI), the US crude oil benchmark, dropped more than 2% on risk-off impulse, with a bank crisis in the United States (US) raising fears for a possible contagion. Nevertheless, a recovery in Chinese demand put a lid on WTI’s fall. At the time of writing, WTI is trading at $74.54 after hitting a high of $77.42.
US assets dropped in value last week due to worries about the impact of Silicon Valley Bank’s collapse, and regulators shut down another bank in New York on Sunday.
On Monday, U.S. stocks were mostly up but volatile as investors wondered if the Fed would stop raising interest rates in March. The government took urgent steps on Sunday to boost trust in the banks. [.N]
The sudden closure of SVB Financial raised questions about how other banks were affected by the Fed’s fast rate increases in the past year. It also made investors think the central bank might slow down its monetary policy.
Oil prices fluctuated on Monday as investors assessed how the news would affect the market. WTI price usually increases with a weaker US Dollar because oil becomes more affordable for people who use other currencies.
High US oil stockpiles have also pressured oil prices, which indicates weak demand.
Oil’s decline came after a positive day on Friday when US job data was better than expected. The number of jobs added in February was 311,000, much higher than the predicted 205,000 by market participants.
When sentiment shifted sour, the US crude oil benchmark fell toward its daily low of $72.36. Buyers stepped in and dragged prices up, but buyers failed to reclaim the 20-day EMA at $77.01. WTI’s bias remains downward biased, and it might retest March lows, but it would need to clear support areas. The first support would be $74.00. A break below will expose the February 22 low of $73.83, followed by the $73.00, and then the YTD lows.
Technical Levels: Supports and Resistances
XTIUSD currently trading at 74.69 at the time of writing. Pair opened at 76.63 and is trading with a change of -2.53 % .
| Overview | Overview.1 | |
|---|---|---|
| 0 | Today last price | 74.69 |
| 1 | Today Daily Change | -1.94 |
| 2 | Today Daily Change % | -2.53 |
| 3 | Today daily open | 76.63 |
The pair remains strongly bearish on the daily time frame. It trades below the 20 SMA @ 77.38, 50 SMA 77.83, 100 SMA @ 79.43 and 200 SMA @ 86.8.
| Trends | Trends.1 | |
|---|---|---|
| 0 | Daily SMA20 | 77.38 |
| 1 | Daily SMA50 | 77.83 |
| 2 | Daily SMA100 | 79.43 |
| 3 | Daily SMA200 | 86.80 |
The previous day high was 77.18 while the previous day low was 74.89. The daily 38.2% Fib levels comes at 76.31, expected to provide resistance. Similarly, the daily 61.8% fib level is at 75.77, expected to provide resistance.
Note the levels of interest below:
- Pivot support is noted at 75.29, 73.94, 73.0
- Pivot resistance is noted at 77.58, 78.53, 79.87
| Levels | Levels.1 |
|---|---|
| Previous Daily High | 77.18 |
| Previous Daily Low | 74.89 |
| Previous Weekly High | 80.99 |
| Previous Weekly Low | 74.89 |
| Previous Monthly High | 80.75 |
| Previous Monthly Low | 72.50 |
| Daily Fibonacci 38.2% | 76.31 |
| Daily Fibonacci 61.8% | 75.77 |
| Daily Pivot Point S1 | 75.29 |
| Daily Pivot Point S2 | 73.94 |
| Daily Pivot Point S3 | 73.00 |
| Daily Pivot Point R1 | 77.58 |
| Daily Pivot Point R2 | 78.53 |
| Daily Pivot Point R3 | 79.87 |
[/s2If]
Join Our Telegram Group
")


