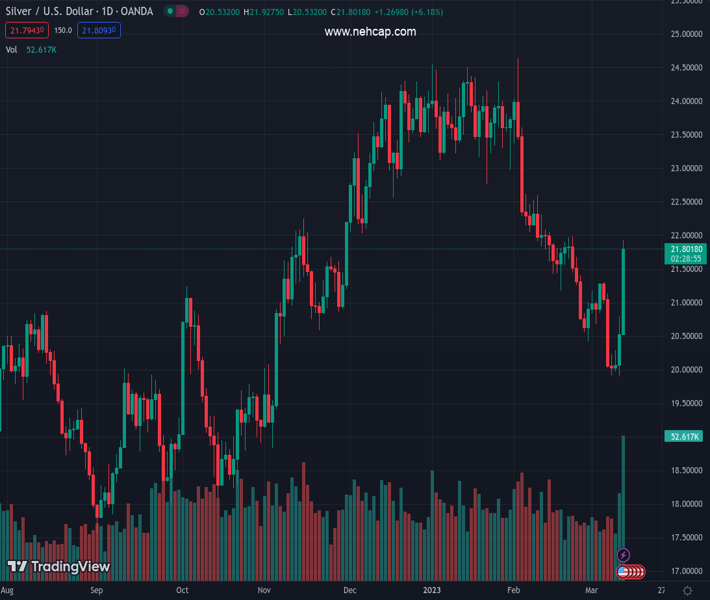
#XAGUSD @ 21.802 advances as US Treasury bond yields undermine the US Dollar. (Pivot Orderbook analysis)
…
This is a premium post.
[s2If !current_user_can(access_s2member_level4)]Please register for PREMIUM VERSION HERE to read full post below containing analysis. In case of any error or you think you are not able to read the full post below, please email us at support#nehcap.com [lwa][/s2If] [s2If current_user_can(access_s2member_level4)]
- XAG/USD advances as US Treasury bond yields undermine the US Dollar.
- The XAG/USD is testing the confluence of the 50/100/200-day EMAs.
- XAG/USD Price Analysis: To remain upwards in the short term, though the rally’s size suggests a mean reversion correction.
The pair currently trades last at 21.802.
The previous day high was 20.79 while the previous day low was 19.9. The daily 38.2% Fib levels comes at 20.45, expected to provide support. Similarly, the daily 61.8% fib level is at 20.24, expected to provide support.
XAG/USD surges sharply in Monday’s session, up by more than 6% on investors flying to safety. US Treasury bond yields collapsed due to regional bank failure in the United States (US) blamed on higher rates. Therefore, US bond yields collapsing are a tailwind for the white metal prices. At the time of writing, the XAG/USD is trading at $21.76.
The white metal is testing solid resistance in the confluence of the 200, 50, and 100-day Exponential Moving Averages (EMAs), each at $21.79, $21.85, and $21.87, respectively. In addition, the Relative Strength Index (RSI) broke above the 50 neutral lines, portraying buying pressure strength. The Rate of Change (RoC) suggests buyers moved aggressively, which could open the door for a mean reversion move. Therefore, traders should be careful.
With XAG/USD breaking above the 200-day EMA would pave the way toward $22.00 a troy ounce. Once done, the XAG/USD next resistance would be $23.00 before testing the February 23 high at $23.59.
In an alternate scenario, the XAG/USD first support would be the 20-day EMA at $21.16. A breach of the latter will expose the $21.00 figure, followed by the March 13 low of $20.50, before falling to YTD lows at $19.92.
Technical Levels: Supports and Resistances
XAGUSD currently trading at 21.78 at the time of writing. Pair opened at 20.53 and is trading with a change of 6.09 % .
| Overview | Overview.1 | |
|---|---|---|
| 0 | Today last price | 21.78 |
| 1 | Today Daily Change | 1.25 |
| 2 | Today Daily Change % | 6.09 |
| 3 | Today daily open | 20.53 |
The pair is trading above its 20 Daily moving average @ 21.13, below its 50 Daily moving average @ 22.52 , below its 100 Daily moving average @ 22.2 and above its 200 Daily moving average @ 20.94
| Trends | Trends.1 | |
|---|---|---|
| 0 | Daily SMA20 | 21.13 |
| 1 | Daily SMA50 | 22.52 |
| 2 | Daily SMA100 | 22.20 |
| 3 | Daily SMA200 | 20.94 |
The previous day high was 20.79 while the previous day low was 19.9. The daily 38.2% Fib levels comes at 20.45, expected to provide support. Similarly, the daily 61.8% fib level is at 20.24, expected to provide support.
Note the levels of interest below:
- Pivot support is noted at 20.02, 19.52, 19.13
- Pivot resistance is noted at 20.91, 21.3, 21.81
| Levels | Levels.1 |
|---|---|
| Previous Daily High | 20.79 |
| Previous Daily Low | 19.90 |
| Previous Weekly High | 21.31 |
| Previous Weekly Low | 19.90 |
| Previous Monthly High | 24.64 |
| Previous Monthly Low | 20.42 |
| Daily Fibonacci 38.2% | 20.45 |
| Daily Fibonacci 61.8% | 20.24 |
| Daily Pivot Point S1 | 20.02 |
| Daily Pivot Point S2 | 19.52 |
| Daily Pivot Point S3 | 19.13 |
| Daily Pivot Point R1 | 20.91 |
| Daily Pivot Point R2 | 21.30 |
| Daily Pivot Point R3 | 21.81 |
[/s2If]
Join Our Telegram Group
")


