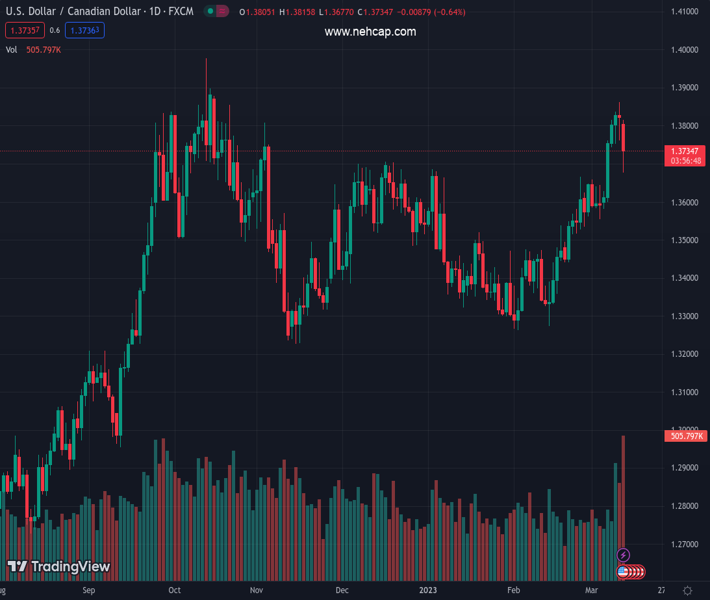
#USDCAD @ 1.37306 falls amidst broad US Dollar weakness across the board., @nehcap view: In the near term, neutral to downwards. (Pivot Orderbook analysis)
…
This is a premium post.
[s2If !current_user_can(access_s2member_level4)]Please register for PREMIUM VERSION HERE to read full post below containing analysis. In case of any error or you think you are not able to read the full post below, please email us at support#nehcap.com [lwa][/s2If] [s2If current_user_can(access_s2member_level4)]
- USD/CAD falls amidst broad US Dollar weakness across the board.
- The SVB crisis in the United States sent ripples in the financial markets, with UST bond yields plummeting.
- USD/CAD Price Analysis: In the near term, neutral to downward biased.
The pair currently trades last at 1.37306.
The previous day high was 1.3862 while the previous day low was 1.3761. The daily 38.2% Fib levels comes at 1.38, expected to provide resistance. Similarly, the daily 61.8% fib level is at 1.3823, expected to provide resistance.
USD/CAD drops from around daily highs of 1.3815, falls 0.90% on overall US Dollar (USD) weakness, spurred on an ongoing Regional Bank crisis in the US. Therefore, UST bond yields plunge; consequently, the buck is down. At the time of writing, the USD/CAD is trading at 1.3692.
After rallying to YTD highs of 1.3862, the Canadian dollar (CAD) is recovering some ground, eyeing a daily close below the December 12 high at 1.3705. Even though the financial markets are punishing the US Dollar (USD), safe-haven flows would increase volatility in USD-denominated currency pairs. If the banking crisis ease, traders should expect a repricing of the Fed, meaning further upside in the USD/CAD is expected.
In the short term, the USD/CAD might fall toward 1.3600, but solid support areas would face it. The first support would be the February 20 daily high at 1.3665, followed by the 1.3600 figure. A breach of the latter will expose the 20-day Exponential Moving Average (EMA) at 1.3496 before testing the 50-day EMA at 1.3280.
In an alternate scenario, the USD/CAD first resistance would be 1.3700. Once cleared, the pair could rally towards the 1.3800 area, ahead of testing the YTD high at 1.3862.
Oscillators like the Relative Strength Index (RSI) at 58.22 aiming lower suggests that sellers are gathering momentum. The Rate of Change (RoC), shifted toward neutral territory, displaying that buying pressure is waning.
Trend: In the near term, neutral to downwards.
Technical Levels: Supports and Resistances
USDCAD currently trading at 1.3687 at the time of writing. Pair opened at 1.3833 and is trading with a change of -1.06 % .
| Overview | Overview.1 | |
|---|---|---|
| 0 | Today last price | 1.3687 |
| 1 | Today Daily Change | -0.0146 |
| 2 | Today Daily Change % | -1.0600 |
| 3 | Today daily open | 1.3833 |
The pair remains strongly bullish on the daily timeframe. It trades above its 20 SMA @ 1.3576, 50 SMA 1.348, 100 SMA @ 1.3504 and 200 SMA @ 1.3313.
| Trends | Trends.1 | |
|---|---|---|
| 0 | Daily SMA20 | 1.3576 |
| 1 | Daily SMA50 | 1.3480 |
| 2 | Daily SMA100 | 1.3504 |
| 3 | Daily SMA200 | 1.3313 |
The previous day high was 1.3862 while the previous day low was 1.3761. The daily 38.2% Fib levels comes at 1.38, expected to provide resistance. Similarly, the daily 61.8% fib level is at 1.3823, expected to provide resistance.
Note the levels of interest below:
- Pivot support is noted at 1.3775, 1.3718, 1.3675
- Pivot resistance is noted at 1.3876, 1.3919, 1.3977
| Levels | Levels.1 |
|---|---|
| Previous Daily High | 1.3862 |
| Previous Daily Low | 1.3761 |
| Previous Weekly High | 1.3862 |
| Previous Weekly Low | 1.3582 |
| Previous Monthly High | 1.3666 |
| Previous Monthly Low | 1.3262 |
| Daily Fibonacci 38.2% | 1.3800 |
| Daily Fibonacci 61.8% | 1.3823 |
| Daily Pivot Point S1 | 1.3775 |
| Daily Pivot Point S2 | 1.3718 |
| Daily Pivot Point S3 | 1.3675 |
| Daily Pivot Point R1 | 1.3876 |
| Daily Pivot Point R2 | 1.3919 |
| Daily Pivot Point R3 | 1.3977 |
[/s2If]
Join Our Telegram Group
")


