#AUDUSD @ 0.66793 soars to 0.6718 amid catastrophic SVB bank collapse (Pivot Orderbook analysis)
…
This is a premium post.
[s2If !current_user_can(access_s2member_level4)]Please register for PREMIUM VERSION HERE to read full post below containing analysis. In case of any error or you think you are not able to read the full post below, please email us at support#nehcap.com [lwa][/s2If] [s2If current_user_can(access_s2member_level4)]
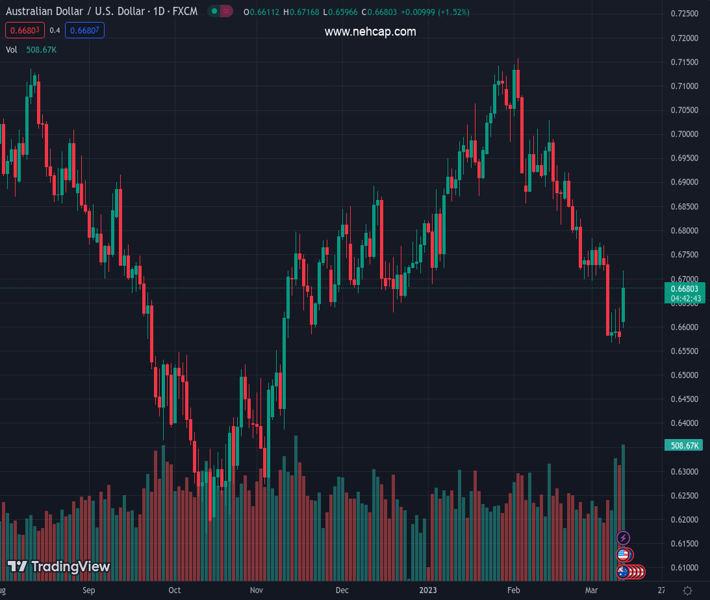
The pair currently trades last at 0.66793.
The previous day high was 0.664 while the previous day low was 0.6564. The daily 38.2% Fib levels comes at 0.6593, expected to provide support. Similarly, the daily 61.8% fib level is at 0.6611, expected to provide support.
AUD/USD currency pair opens the first day of a new week at 0.6575, with an intraday high of 0.6718 and a low of 0.6577. The pair trades at 0.6716 at the press time, up by 2.11% on the day, just below Monday’s ATH price.
The recent issues with Silicon Valley Bank (SVB) and Signature Bank have highlighted the vulnerable state of US banks, which has dampened expectations for additional interest rate increases from the Federal Reserve (Fed). As a result, Goldman Sachs now predicts a delay in rate hikes in March, and the Fed Fund futures (*) have reduced the likelihood of a 0.50% increase in the Fed rate.
Consequently, the US Dollar Index (DXY) has fallen to its lowest level in a month, trading near 103.60 at the press time.
* Fed Fund futures directly reflect collective marketplace insight regarding the future course of the Federal Reserve’s monetary policy. (Source: CME Group’s website)
Investors will be closely watching the US Consumer Price Index (CPI) (excluding Food and Energy) data for February, set to be released on Tuesday, to gain a better understanding of potential Federal Reserve (Fed) actions on the pace of interest rate increases, which could impact the strength of the US Dollar.
Additionally, both the Employment Change s.a. (Feb) and Unemployment Rate s.a. (Feb) released by the Australian Bureau of Statistics on Thursday will be the key economic events for AUD this week.
Technical indicators suggest a potential bullish outlook for the AUD/USD in the short term. The 20-day SMA and 50-day SMA are at 0.6777 and 0.6885, respectively, indicating a possible bullish trend. The daily 38.2% Fibonacci level is at 0.6593, with the 61.8% Fibonacci level at 0.6611. The RSI(14) is at 44.516, indicating potential bullish momentum. Resistance levels for AUD/USD are at 0.6623, 0.6670, and 0.6699, while support levels stand at 0.6547, 0.6517, and 0.6471. The daily pivot point is at 0.6594.
Technical Levels: Supports and Resistances
AUDUSD currently trading at 0.6715 at the time of writing. Pair opened at 0.6576 and is trading with a change of 2.11 % .
| Overview | Overview.1 | |
|---|---|---|
| 0 | Today last price | 0.6715 |
| 1 | Today Daily Change | 0.0139 |
| 2 | Today Daily Change % | 2.1100 |
| 3 | Today daily open | 0.6576 |
The pair remains strongly bearish on the daily time frame. It trades below the 20 SMA @ 0.6777, 50 SMA 0.6885, 100 SMA @ 0.6765 and 200 SMA @ 0.6777.
| Trends | Trends.1 | |
|---|---|---|
| 0 | Daily SMA20 | 0.6777 |
| 1 | Daily SMA50 | 0.6885 |
| 2 | Daily SMA100 | 0.6765 |
| 3 | Daily SMA200 | 0.6777 |
The previous day high was 0.664 while the previous day low was 0.6564. The daily 38.2% Fib levels comes at 0.6593, expected to provide support. Similarly, the daily 61.8% fib level is at 0.6611, expected to provide support.
Note the levels of interest below:
- Pivot support is noted at 0.6547, 0.6517, 0.6471
- Pivot resistance is noted at 0.6623, 0.667, 0.6699
| Levels | Levels.1 |
|---|---|
| Previous Daily High | 0.6640 |
| Previous Daily Low | 0.6564 |
| Previous Weekly High | 0.6770 |
| Previous Weekly Low | 0.6564 |
| Previous Monthly High | 0.7158 |
| Previous Monthly Low | 0.6698 |
| Daily Fibonacci 38.2% | 0.6593 |
| Daily Fibonacci 61.8% | 0.6611 |
| Daily Pivot Point S1 | 0.6547 |
| Daily Pivot Point S2 | 0.6517 |
| Daily Pivot Point S3 | 0.6471 |
| Daily Pivot Point R1 | 0.6623 |
| Daily Pivot Point R2 | 0.6670 |
| Daily Pivot Point R3 | 0.6699 |
[/s2If]
Join Our Telegram Group
")


