#XAGUSD @ 21.450 Price surges on bullish market sentiment (Pivot Orderbook analysis)
…
This is a premium post.
[s2If !current_user_can(access_s2member_level4)]Please register for PREMIUM VERSION HERE to read full post below containing analysis. In case of any error or you think you are not able to read the full post below, please email us at support#nehcap.com [lwa][/s2If] [s2If current_user_can(access_s2member_level4)]
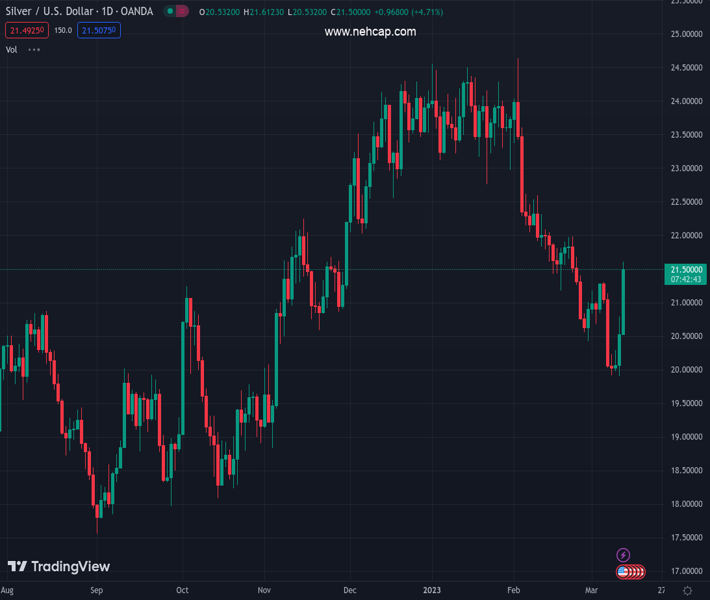
The pair currently trades last at 21.450.
The previous day high was 20.79 while the previous day low was 19.9. The daily 38.2% Fib levels comes at 20.45, expected to provide support. Similarly, the daily 61.8% fib level is at 20.24, expected to provide support.
XAG/USD (Silver) opens the day at $20.54, with the precious metal experiencing an intraday gain of 5.24% to trade at $21.61 at the time of press. Silver hits an intraday high of $21.61, indicating a surge in bullish market sentiment.
Markets will be monitoring Tuesday’s US Consumer Price Index ex Food & Energy (MoM)(Feb) data to understand better the possible Fed actions on the speed of rate hikes decisions which will affect the US Dollar’s strength.
Technical indicators suggest a potential bullish outlook for XAG/USD silver in the short term. The RSI(14) is currently at 52.93, indicating bullish momentum. The daily 20-SMA is $21.03, indicating that the current price may trend higher. Daily pivot resistance levels for Silver are $20.91, $21.30, and $21.81, while support levels stand at $20.02, $19.52, and $19.13. However, the daily 50-SMA is $22.40, indicating a long-term bearish trend.
Technical Levels: Supports and Resistances
XAGUSD currently trading at 21.59 at the time of writing. Pair opened at 20.53 and is trading with a change of 5.16 % .
| Overview | Overview.1 | |
|---|---|---|
| 0 | Today last price | 21.59 |
| 1 | Today Daily Change | 1.06 |
| 2 | Today Daily Change % | 5.16 |
| 3 | Today daily open | 20.53 |
The pair is trading above its 20 Daily moving average @ 21.13, below its 50 Daily moving average @ 22.52 , below its 100 Daily moving average @ 22.2 and above its 200 Daily moving average @ 20.94
| Trends | Trends.1 | |
|---|---|---|
| 0 | Daily SMA20 | 21.13 |
| 1 | Daily SMA50 | 22.52 |
| 2 | Daily SMA100 | 22.20 |
| 3 | Daily SMA200 | 20.94 |
The previous day high was 20.79 while the previous day low was 19.9. The daily 38.2% Fib levels comes at 20.45, expected to provide support. Similarly, the daily 61.8% fib level is at 20.24, expected to provide support.
Note the levels of interest below:
- Pivot support is noted at 20.02, 19.52, 19.13
- Pivot resistance is noted at 20.91, 21.3, 21.81
| Levels | Levels.1 |
|---|---|
| Previous Daily High | 20.79 |
| Previous Daily Low | 19.90 |
| Previous Weekly High | 21.31 |
| Previous Weekly Low | 19.90 |
| Previous Monthly High | 24.64 |
| Previous Monthly Low | 20.42 |
| Daily Fibonacci 38.2% | 20.45 |
| Daily Fibonacci 61.8% | 20.24 |
| Daily Pivot Point S1 | 20.02 |
| Daily Pivot Point S2 | 19.52 |
| Daily Pivot Point S3 | 19.13 |
| Daily Pivot Point R1 | 20.91 |
| Daily Pivot Point R2 | 21.30 |
| Daily Pivot Point R3 | 21.81 |
[/s2If]
Join Our Telegram Group
")


