#XAUUSD @ 1,899.38 Gold rally goes on, tests $1,900. (Pivot Orderbook analysis)
…
This is a premium post.
[s2If !current_user_can(access_s2member_level4)]Please register for PREMIUM VERSION HERE to read full post below containing analysis. In case of any error or you think you are not able to read the full post below, please email us at support#nehcap.com [lwa][/s2If] [s2If current_user_can(access_s2member_level4)]
- Gold rally goes on, tests $1,900.
- Yellow metal rises 5% in three trading days.
- US Yields hit lowest levels in months amid risk aversion.
The pair currently trades last at 1899.38.
The previous day high was 1870.09 while the previous day low was 1827.77. The daily 38.2% Fib levels comes at 1853.92, expected to provide support. Similarly, the daily 61.8% fib level is at 1843.94, expected to provide support.
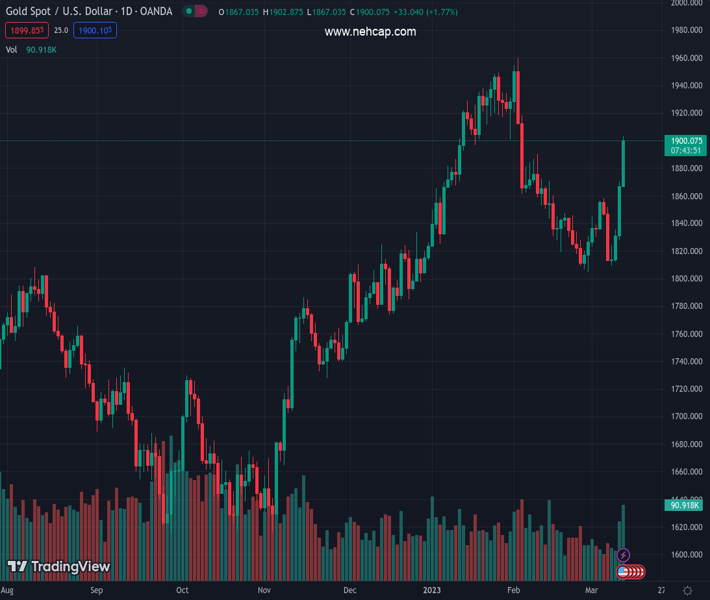
Gold price is up by more than 2% on Monday, adding to last Friday’s gains boosted by a rally in US Treasury bonds as investors fly to safety and pare Federal Reserve rate hike bets.
XAU/USD hit $1,900 for the first time since February 3. It then pulled back modestly to $1,895. The rally in gold has been dramatic, rising more than $90 since Thursday. Above $1,900 the next resistance area is seen around $1,920.
The key driver of the yellow metal rally is the sharp decline in US yields. The US 10-year has fallen from above 4.0% to 3.41%, approaching year-to-day lows; the 2-year was above 5.0% on Wednesday (highest since 2008) and a few moments ago reached the lowest intraday level since October at 4.00%.
The collapse of the Silicon Valley Bank triggered concerns about the banking sector, weighing on Fed rate hike expectations. Investors are looking at the impact of the crisis that is offsetting incoming economic data. On Tuesday, the US February Consumer Price Index is due and it was supposed to be critical for monetary expectations. After the SVB collapse, markets are pricing in a softer Fed.
Technical Levels: Supports and Resistances
XAUUSD currently trading at 1899.46 at the time of writing. Pair opened at 1869.92 and is trading with a change of 1.58 % .
| Overview | Overview.1 | |
|---|---|---|
| 0 | Today last price | 1899.46 |
| 1 | Today Daily Change | 29.54 |
| 2 | Today Daily Change % | 1.58 |
| 3 | Today daily open | 1869.92 |
The pair remains strongly bullish on the daily timeframe. It trades above its 20 SMA @ 1835.48, 50 SMA 1871.07, 100 SMA @ 1810.46 and 200 SMA @ 1775.06.
| Trends | Trends.1 | |
|---|---|---|
| 0 | Daily SMA20 | 1835.48 |
| 1 | Daily SMA50 | 1871.07 |
| 2 | Daily SMA100 | 1810.46 |
| 3 | Daily SMA200 | 1775.06 |
The previous day high was 1870.09 while the previous day low was 1827.77. The daily 38.2% Fib levels comes at 1853.92, expected to provide support. Similarly, the daily 61.8% fib level is at 1843.94, expected to provide support.
Note the levels of interest below:
- Pivot support is noted at 1841.76, 1813.61, 1799.44
- Pivot resistance is noted at 1884.08, 1898.25, 1926.4
| Levels | Levels.1 |
|---|---|
| Previous Daily High | 1870.09 |
| Previous Daily Low | 1827.77 |
| Previous Weekly High | 1870.09 |
| Previous Weekly Low | 1809.46 |
| Previous Monthly High | 1959.80 |
| Previous Monthly Low | 1804.76 |
| Daily Fibonacci 38.2% | 1853.92 |
| Daily Fibonacci 61.8% | 1843.94 |
| Daily Pivot Point S1 | 1841.76 |
| Daily Pivot Point S2 | 1813.61 |
| Daily Pivot Point S3 | 1799.44 |
| Daily Pivot Point R1 | 1884.08 |
| Daily Pivot Point R2 | 1898.25 |
| Daily Pivot Point R3 | 1926.40 |
[/s2If]
Join Our Telegram Group
")


