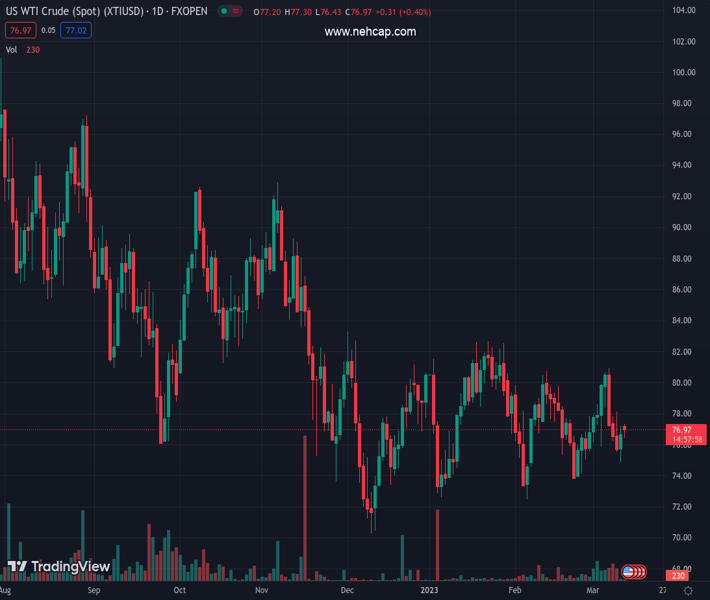
WTI crude oil defends the previous day’s bounce off two-week low despite lacking upside momentum of late. (Pivot Orderbook analysis)
…
This is a premium post.
[s2If !current_user_can(access_s2member_level4)]Please register for PREMIUM VERSION HERE to read full post below containing analysis. In case of any error or you think you are not able to read the full post below, please email us at support#nehcap.com [lwa][/s2If] [s2If current_user_can(access_s2member_level4)]
- WTI crude oil defends the previous day’s bounce off two-week low despite lacking upside momentum of late.
- Risk-on mood, receding hawkish Fed bets underpin WTI strength.
- US-China tension, cautious mood ahead of OPEC, EIA reports and US inflation probe energy buyers.
The pair currently trades last at 76.95.
The previous day high was 77.18 while the previous day low was 74.89. The daily 38.2% Fib levels comes at 76.31, expected to provide support. Similarly, the daily 61.8% fib level is at 75.77, expected to provide support.
WTI crude oil remains sidelined near $77.00 as bulls struggle to cheer the broadly risk-on mood and the US Dollar weakness during early Monday. Even so, the black gold defends the previous day’s rebound from a short-term support line ahead of the monthly Oil market reports from the US Energy Information Administration (EIA) and the Organization of the Petroleum Exporting Countries (OPEC).
The commodity prices initially dropped to the two-week low before bouncing off $74.90 on the US Dollar’s slump despite witnessing the better-than-forecast Nonfarm Payrolls (NFP) reports. It should be noted that the fears emanating from the Silicon Valley Bank (SVB) and Signature Bank fallout drowned the US Treasury bond yields and the US Dollar on Friday.
However, the US Treasury Department, Federal Reserve and the Federal Deposit Insurance Corporation (FDIC) undertook joint actions to tame the risks during the weekend. While reacting to the US regulators’ actions, US President Joe Biden said, “American people and American businesses can have confidence that their bank deposits will be there when they need them.”
Even so, the market’s concerns that the SVB and Signature Bank flagged fragile conditions of the US banks pushed back hopes of more rate hikes from the US Federal Reserve (Fed) and drowned the US Treasury bond yields despite the risk-on mood during early Monday. With this in mind, Goldman Sachs expects to rate hike in March while the Fed Fund Futures also cut previously upbeat odds favoring a 0.50% rate lift in the Fed rate in March.
Elsewhere, a new term for China’s President Xi Jinping keeps the Sino-American tension on the table as he said earlier on Monday that they must resolutely oppose the interference of external forces, ‘split’ of Taiwan. The same raised fears of less energy demand from China and the US amid a lack of activity due to geopolitical tension.
Against this backdrop, S&P 500 Futures bounced off a 2.5-month low, up nearly 1.60% around 3,960 by the press time, whereas the US Treasury bond yields reverse the early-day rebound from monthly low amid fresh challenges for the hawkish Fed bets.
Looking ahead, Tuesday’s US Consumer Price Index (CPI) for February to direct immediate market moves. Following that, the Retail Sales and preliminary readings of the Michigan Consumer Sentiment Index for March, up for publishing on Wednesday and Friday, will be crucial for WTI crude oil traders to watch for clear direction.
Above all, monthly energy market reports from the OPEC and the EIA will be important for the WTI crude oil traders.
Although a five-week-old support line restricts immediate WTI crude oil downside near $75.00, a daily closing beyond the 50-DMA hurdle surrounding $77.75 becomes necessary for the Crude Oil price to keep the buyers in the driver’s seat.
Technical Levels: Supports and Resistances
XTIUSD currently trading at 76.95 at the time of writing. Pair opened at 76.63 and is trading with a change of 0.42% % .
| Overview | Overview.1 | |
|---|---|---|
| 0 | Today last price | 76.95 |
| 1 | Today Daily Change | 0.32 |
| 2 | Today Daily Change % | 0.42% |
| 3 | Today daily open | 76.63 |
The pair remains strongly bearish on the daily time frame. It trades below the 20 SMA @ 77.38, 50 SMA 77.83, 100 SMA @ 79.43 and 200 SMA @ 86.8.
| Trends | Trends.1 | |
|---|---|---|
| 0 | Daily SMA20 | 77.38 |
| 1 | Daily SMA50 | 77.83 |
| 2 | Daily SMA100 | 79.43 |
| 3 | Daily SMA200 | 86.80 |
The previous day high was 77.18 while the previous day low was 74.89. The daily 38.2% Fib levels comes at 76.31, expected to provide support. Similarly, the daily 61.8% fib level is at 75.77, expected to provide support.
Note the levels of interest below:
- Pivot support is noted at 75.29, 73.94, 73.0
- Pivot resistance is noted at 77.58, 78.53, 79.87
| Levels | Levels.1 |
|---|---|
| Previous Daily High | 77.18 |
| Previous Daily Low | 74.89 |
| Previous Weekly High | 80.99 |
| Previous Weekly Low | 74.89 |
| Previous Monthly High | 80.75 |
| Previous Monthly Low | 72.50 |
| Daily Fibonacci 38.2% | 76.31 |
| Daily Fibonacci 61.8% | 75.77 |
| Daily Pivot Point S1 | 75.29 |
| Daily Pivot Point S2 | 73.94 |
| Daily Pivot Point S3 | 73.00 |
| Daily Pivot Point R1 | 77.58 |
| Daily Pivot Point R2 | 78.53 |
| Daily Pivot Point R3 | 79.87 |
[/s2If]
Join Our Telegram Group
")


