#USDCAD @ 1.37592 climbs to a fresh YTD peak and draws support from a combination of factors. (Pivot Orderbook analysis)
…
This is a premium post.
[s2If !current_user_can(access_s2member_level4)]Please register for PREMIUM VERSION HERE to read full post below containing analysis. In case of any error or you think you are not able to read the full post below, please email us at support#nehcap.com [lwa][/s2If] [s2If current_user_can(access_s2member_level4)]
- USD/CAD climbs to a fresh YTD peak and draws support from a combination of factors.
- Softer Oil prices undermine the Loonie and act as a tailwind amid sustained USD buying.
- Traders look to the BoC policy decision and US labor market reports for a fresh impetus.
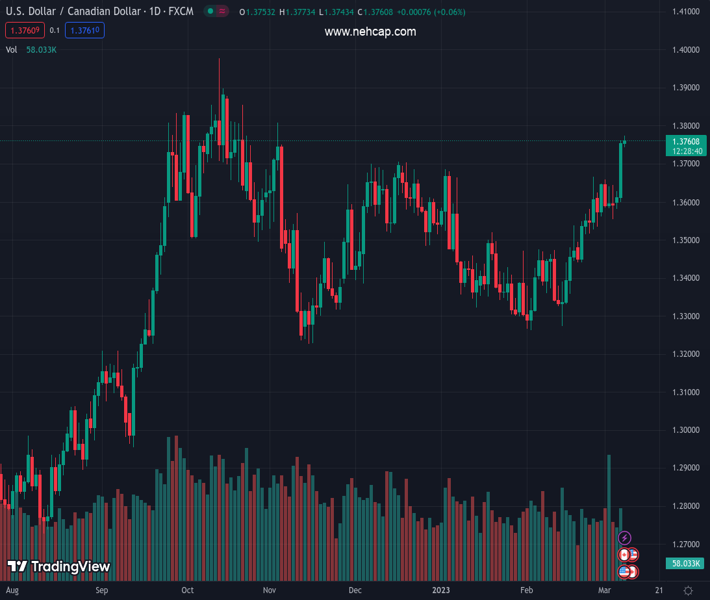
The pair currently trades last at 1.37592.
The previous day high was 1.3761 while the previous day low was 1.36. The daily 38.2% Fib levels comes at 1.37, expected to provide support. Similarly, the daily 61.8% fib level is at 1.3661, expected to provide support.
The USD/CAD pair builds on the previous day’s bullish breakout momentum through the 1.3700 mark and climbs to its highest level since early November on Wednesday. The pair holds steady above mid-1.3700s through the first half of the European session and seems poised to prolong its recent upward trajectory witnessed over the past three weeks or so.
The emergence of fresh selling around Crude Oil prices undermines the commodity-linked Loonie, which, along with sustained US Dollar buying, continues to act as a tailwind for the USD/CAD pair. Investors remain worried that rapidly rising borrowing costs will dampen global economic growth and dent fuel demand. Apart from this, fading optimism over a strong economic recovery in China drags the black liquid lower for the second successive day.
The USD, meanwhile, stands tall near a multi-month peak and continues to draw support from the overnight hawkish remarks by Federal Reserve Chair Jerome Powell. In the prepared remarks for his semi-annual congressional testimony, Powell indicated that interest rates might need to go up faster and higher than previously anticipated. Powell further added that the US central bank is prepared to increase the pace of rate hikes to combat stubbornly high inflation.
This, in turn, lifts bets for a jumbo 50 bps lift-off at the March FOMC meeting and remains supportive of elevated US Treasury bond yields. In fact, the yield on the benchmark 10-year US government bond is holding steady near the 4.0% threshold and the rate-sensitive two-year Treasury note hovers near its highest level since 2007. This, along with growing worries about economic headwinds stemming from rapidly rising borrowing costs, benefits the safe-haven buck.
That said, signs of stability in the equity markets hold back the USD bulls from placing aggressive bets. Traders also seem reluctant and prefer to wait on the sidelines ahead of the Bank of Canada (BoC) meeting later this Wednesday. The Canadian central bank is expected to pause its tightening cycle and leave the overnight rate unchanged. This widens the Fed-BoC policy divergence and supports prospects for a further near-term appreciating move for the USD/CAD pair.
Traders on Wednesday will further take cues from the US economic docket, featuring the release of the ADP report on private-sector employment and JOLTS Job Openings data. This, along with Powell’s second day of congressional testimony, the US bond yields and the broader risk sentiment, will drive the USD demand. Apart from this, Oil price dynamics might further contribute to producing short-term trading opportunities around the USD/CAD pair.
Technical levels to watch
Technical Levels: Supports and Resistances
USDCAD currently trading at 1.3756 at the time of writing. Pair opened at 1.3752 and is trading with a change of 0.03 % .
| Overview | Overview.1 | |
|---|---|---|
| 0 | Today last price | 1.3756 |
| 1 | Today Daily Change | 0.0004 |
| 2 | Today Daily Change % | 0.0300 |
| 3 | Today daily open | 1.3752 |
The pair remains strongly bullish on the daily timeframe. It trades above its 20 SMA @ 1.3516, 50 SMA 1.3464, 100 SMA @ 1.3501 and 200 SMA @ 1.3295.
| Trends | Trends.1 | |
|---|---|---|
| 0 | Daily SMA20 | 1.3516 |
| 1 | Daily SMA50 | 1.3464 |
| 2 | Daily SMA100 | 1.3501 |
| 3 | Daily SMA200 | 1.3295 |
The previous day high was 1.3761 while the previous day low was 1.36. The daily 38.2% Fib levels comes at 1.37, expected to provide support. Similarly, the daily 61.8% fib level is at 1.3661, expected to provide support.
Note the levels of interest below:
- Pivot support is noted at 1.3647, 1.3543, 1.3486
- Pivot resistance is noted at 1.3808, 1.3865, 1.397
| Levels | Levels.1 |
|---|---|
| Previous Daily High | 1.3761 |
| Previous Daily Low | 1.3600 |
| Previous Weekly High | 1.3659 |
| Previous Weekly Low | 1.3534 |
| Previous Monthly High | 1.3666 |
| Previous Monthly Low | 1.3262 |
| Daily Fibonacci 38.2% | 1.3700 |
| Daily Fibonacci 61.8% | 1.3661 |
| Daily Pivot Point S1 | 1.3647 |
| Daily Pivot Point S2 | 1.3543 |
| Daily Pivot Point S3 | 1.3486 |
| Daily Pivot Point R1 | 1.3808 |
| Daily Pivot Point R2 | 1.3865 |
| Daily Pivot Point R3 | 1.3970 |
[/s2If]
Join Our Telegram Group
")


