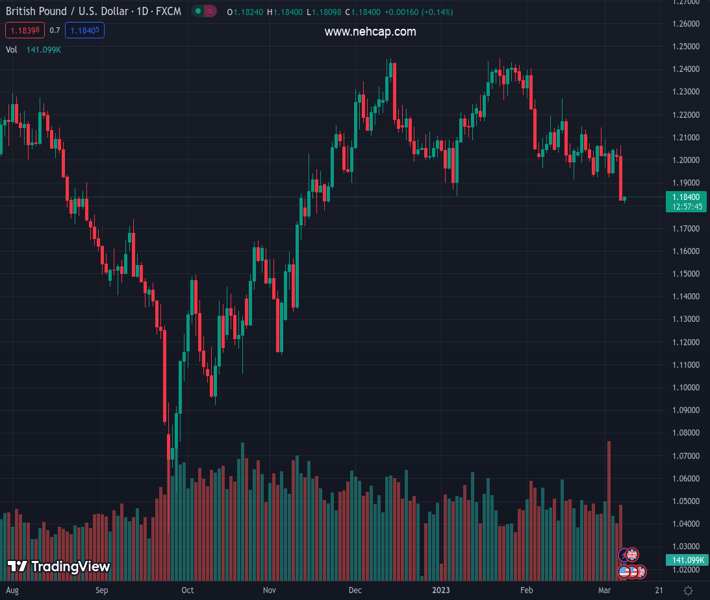
#GBPUSD @ 1.18376 enters a bearish consolidation phase and oscillates in a range around the YTD low. (Pivot Orderbook analysis)
…
This is a premium post.
[s2If !current_user_can(access_s2member_level4)]Please register for PREMIUM VERSION HERE to read full post below containing analysis. In case of any error or you think you are not able to read the full post below, please email us at support#nehcap.com [lwa][/s2If] [s2If current_user_can(access_s2member_level4)]
- GBP/USD enters a bearish consolidation phase and oscillates in a range around the YTD low.
- Bets for more aggressive Fed rate hikes underpin the USD and act as a headwind for the pair.
- Recession risks favour the USD bulls and support prospects for additional losses for the major.
The pair currently trades last at 1.18376.
The previous day high was 1.2065 while the previous day low was 1.1822. The daily 38.2% Fib levels comes at 1.1915, expected to provide resistance. Similarly, the daily 61.8% fib level is at 1.1972, expected to provide resistance.
The GBP/USD pair consolidates the previous day’s heavy losses and oscillates in a narrow band, just a few pips above its lowest level since November set earlier this Wednesday. The pair trades around the 1.1825 region during the first half of the European session and remains vulnerable below a technically significant 200-day Simple Moving Average (SMA).
The US Dollar bulls take a breather following the recent strong run-up to a three-month top amid signs of stability in the equity markets. This, along with the extremely oversold Relative Strength Index (RSI) on hourly charts, is seen lending some support to the GBP/USD pair. That said, any meaningful recovery still seems elusive amid rising bets for more aggressive policy tightening by the Federal Reserve.
In fact, the markets are now pricing in a greater chance of a jumbo 50 bps lift-off at the March FOMC policy meeting. The bets were lifted by Fed Chair Jerome Powell’s remarks on Tuesday, indicating that interest rates might need to go up faster and higher than previously anticipated. Powell further added that the Fed is prepared to increase the pace of rate hikes to combat stubbornly high inflation.
The hawkish outlook remains supportive of elevated US Treasury bond yields, which, along with looming recession risks, support prospects for a further near-term appreciating move for the safe-haven Greenback. In fact, the yield on the benchmark 10-year US government bond holds steady around the 4.0% threshold and the rate-sensitive two-year Treasury note stands tall near its highest level since 2007.
This adds to worries about economic headwinds stemming from rapidly rising borrowing costs. Apart from this, fading hopes over a strong Chinese economic recovery and US-China tensions should keep a lid on any optimism in the markets. Moreover, an additional rate hike by the Bank of England (BoE) is already priced in, suggesting that the path of least resistance for the GBP/USD pair is to the downside.
Market participants now look to the US economic docket, featuring the release of the ADP report on private-sector employment and JOLTS Job Openings data. This, along with the broader risk sentiment, Powell’s second day of testimony before the House Financial Services Committee and the US bond yields, should influence the USD and provide some meaningful impetus to the GBP/USD pair.
Technical Levels: Supports and Resistances
GBPUSD currently trading at 1.1829 at the time of writing. Pair opened at 1.1828 and is trading with a change of 0.01 % .
| Overview | Overview.1 | |
|---|---|---|
| 0 | Today last price | 1.1829 |
| 1 | Today Daily Change | 0.0001 |
| 2 | Today Daily Change % | 0.0100 |
| 3 | Today daily open | 1.1828 |
The pair remains strongly bearish on the daily time frame. It trades below the 20 SMA @ 1.2036, 50 SMA 1.2136, 100 SMA @ 1.1997 and 200 SMA @ 1.1909.
| Trends | Trends.1 | |
|---|---|---|
| 0 | Daily SMA20 | 1.2036 |
| 1 | Daily SMA50 | 1.2136 |
| 2 | Daily SMA100 | 1.1997 |
| 3 | Daily SMA200 | 1.1909 |
The previous day high was 1.2065 while the previous day low was 1.1822. The daily 38.2% Fib levels comes at 1.1915, expected to provide resistance. Similarly, the daily 61.8% fib level is at 1.1972, expected to provide resistance.
Note the levels of interest below:
- Pivot support is noted at 1.1745, 1.1661, 1.1501
- Pivot resistance is noted at 1.1988, 1.2148, 1.2231
| Levels | Levels.1 |
|---|---|
| Previous Daily High | 1.2065 |
| Previous Daily Low | 1.1822 |
| Previous Weekly High | 1.2143 |
| Previous Weekly Low | 1.1922 |
| Previous Monthly High | 1.2402 |
| Previous Monthly Low | 1.1915 |
| Daily Fibonacci 38.2% | 1.1915 |
| Daily Fibonacci 61.8% | 1.1972 |
| Daily Pivot Point S1 | 1.1745 |
| Daily Pivot Point S2 | 1.1661 |
| Daily Pivot Point S3 | 1.1501 |
| Daily Pivot Point R1 | 1.1988 |
| Daily Pivot Point R2 | 1.2148 |
| Daily Pivot Point R3 | 1.2231 |
[/s2If]
Join Our Telegram Group
")


